I've been working on 2.2 for a few months now, ever since 2.1 was released. There's a lot of new stuff in this version. So much that I've been actively delaying writing it up.
Let's get on with it! Here's what's in WhirlyGlobe-Maply 2.2.
Base Map Display
The quad paging layers changed radically in this version. I talk a bit about the underlying technology
elsewhere, suffice it to say that they draw fast. Real fast.
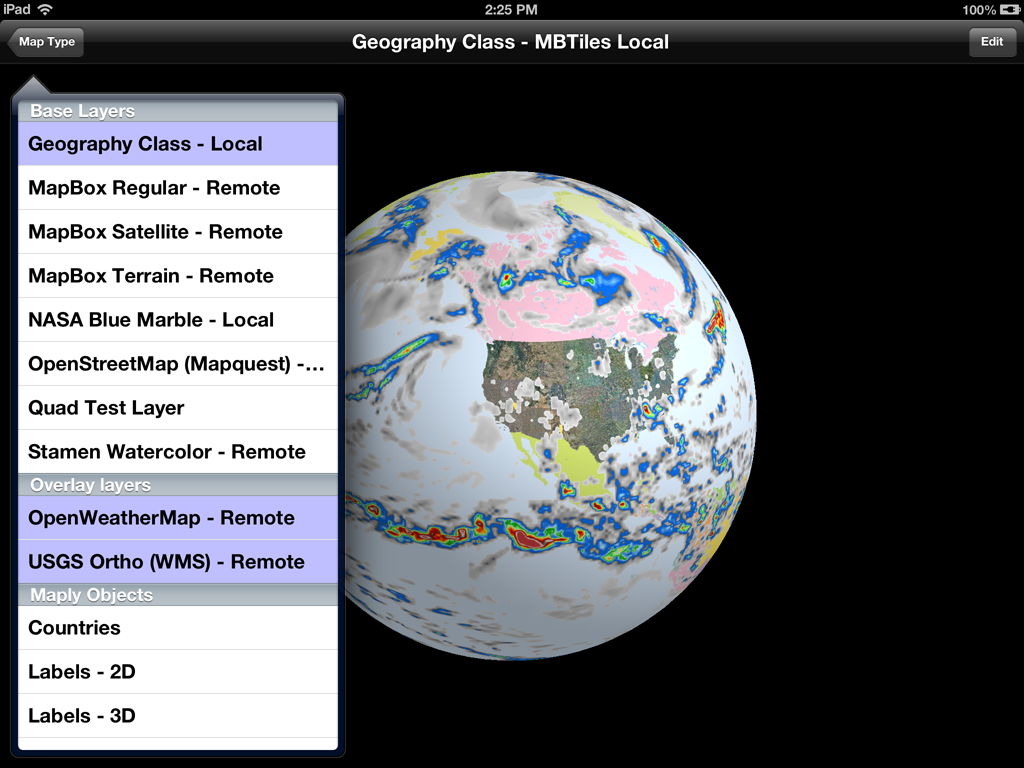
In addition to that (which is big), I've also exposed a lot more functionality at the Component level. Now you can do tricky stuff like this.
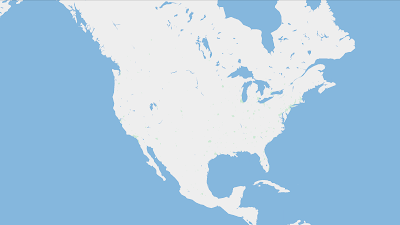
That's three base maps stacked on top of each other:
- My variant of Geography Class, paged locally.
- USGS Ortho photos coming from their WMS server
- Transparent weather data from the OpenWeatherMap server
Each of those layers is independent, with its own coordinate system, level range and protocol. You can now stack these things up to your heart's content and control their order. And it's fast.
In addition to my own low level layers, you can also make your own. Just create a MaplyQuadEarthTilesLayer and hand it an object implementing the MaplyTileSource protocol. Have that object return an image for a given tile and off you go. It even uses dispatch queues.
Vector Paging Layer
Though vector display hasn't changed all that much in 2.2, I have added high level support for paging your own data sets. We organize base image maps as tiles and we can do the same with vector tiles.
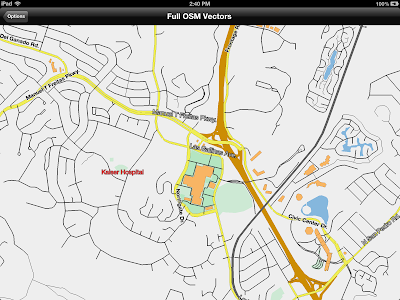 |
| OpenStreetMap vector data |
In this example we're paging vector data from the US OpenStreetMap server. That's an experimental setup where they're serving up GeoJSON tiles, sort of like what we used for images.
You don't have to have GeoJSON or anything specific. Just create a
MaplyQuadPagingLayer and fill in the
MaplyPagingDelegate protocol. You create the visible objects associated with your tile and the Component handles everything else, including cleanup. It's also multi-threaded.
ZBuffer Control / Draw Priority
This one's a bit low level, but really useful. You can now control which features respect the zBuffer (or ignore it) and which write to it. That's incredibly useful for features you want to stick right to the globe.
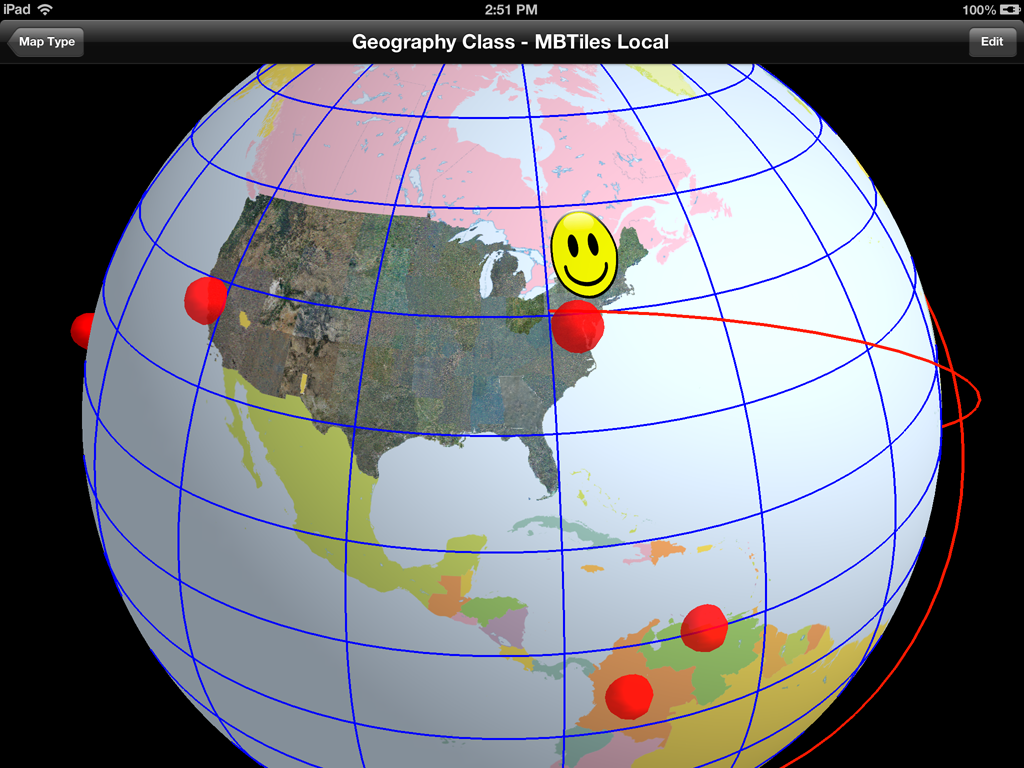
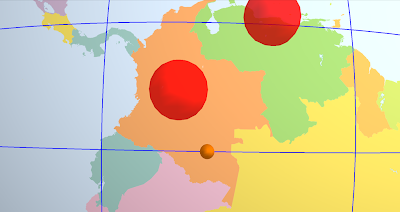
From the picture, here's how the standard defaults play out.
- Geography class is the base layer at priority 100. It writes to the zbuffer, but doesn't read.
- The USGS Ortho layer is next around priority 101. Also writes to the zbuffer, but doesn't read.
- Next, we draw the stickers (priority 30,000) which neither read from nor write to the zbuffer.
- Grid lines (in blue) are drawn next (priority 50,000). They ignore the zbuffer entirely and have a tricky little shader program to deal with the lines behind the globe.
- Lastly, we throw on the shapes, including those spheres and the great circles (with altitude) at about priority 80,000. They read from the z buffer, but don't write to it.
There's also a little book keeping for skirts. What are skirts? Do you see any obvious lines between levels in the base map? That's what skirts do.
That's all without the dreaded drawOffset; drawPriority now rules the day.
Anyway, that's all with the defaults. Odds are you'll never need to set any of this yourself, but it's there if you do.
Text Fonts & Layout
We've now got a font glyph manager. It's not too tricky, but it speeds things up and (potentially) saves a lot of memory.
We used to render each label in Quartz, which worked great, but was kind of slow and a memory hog. Now when you ask for a label, it renders the appropriate glyphs, saves them to a giant texture atlas and makes up the polygons for your string.
When you delete the string, it may delete the glyphs as well. So feel free to use weird fonts with impunity.
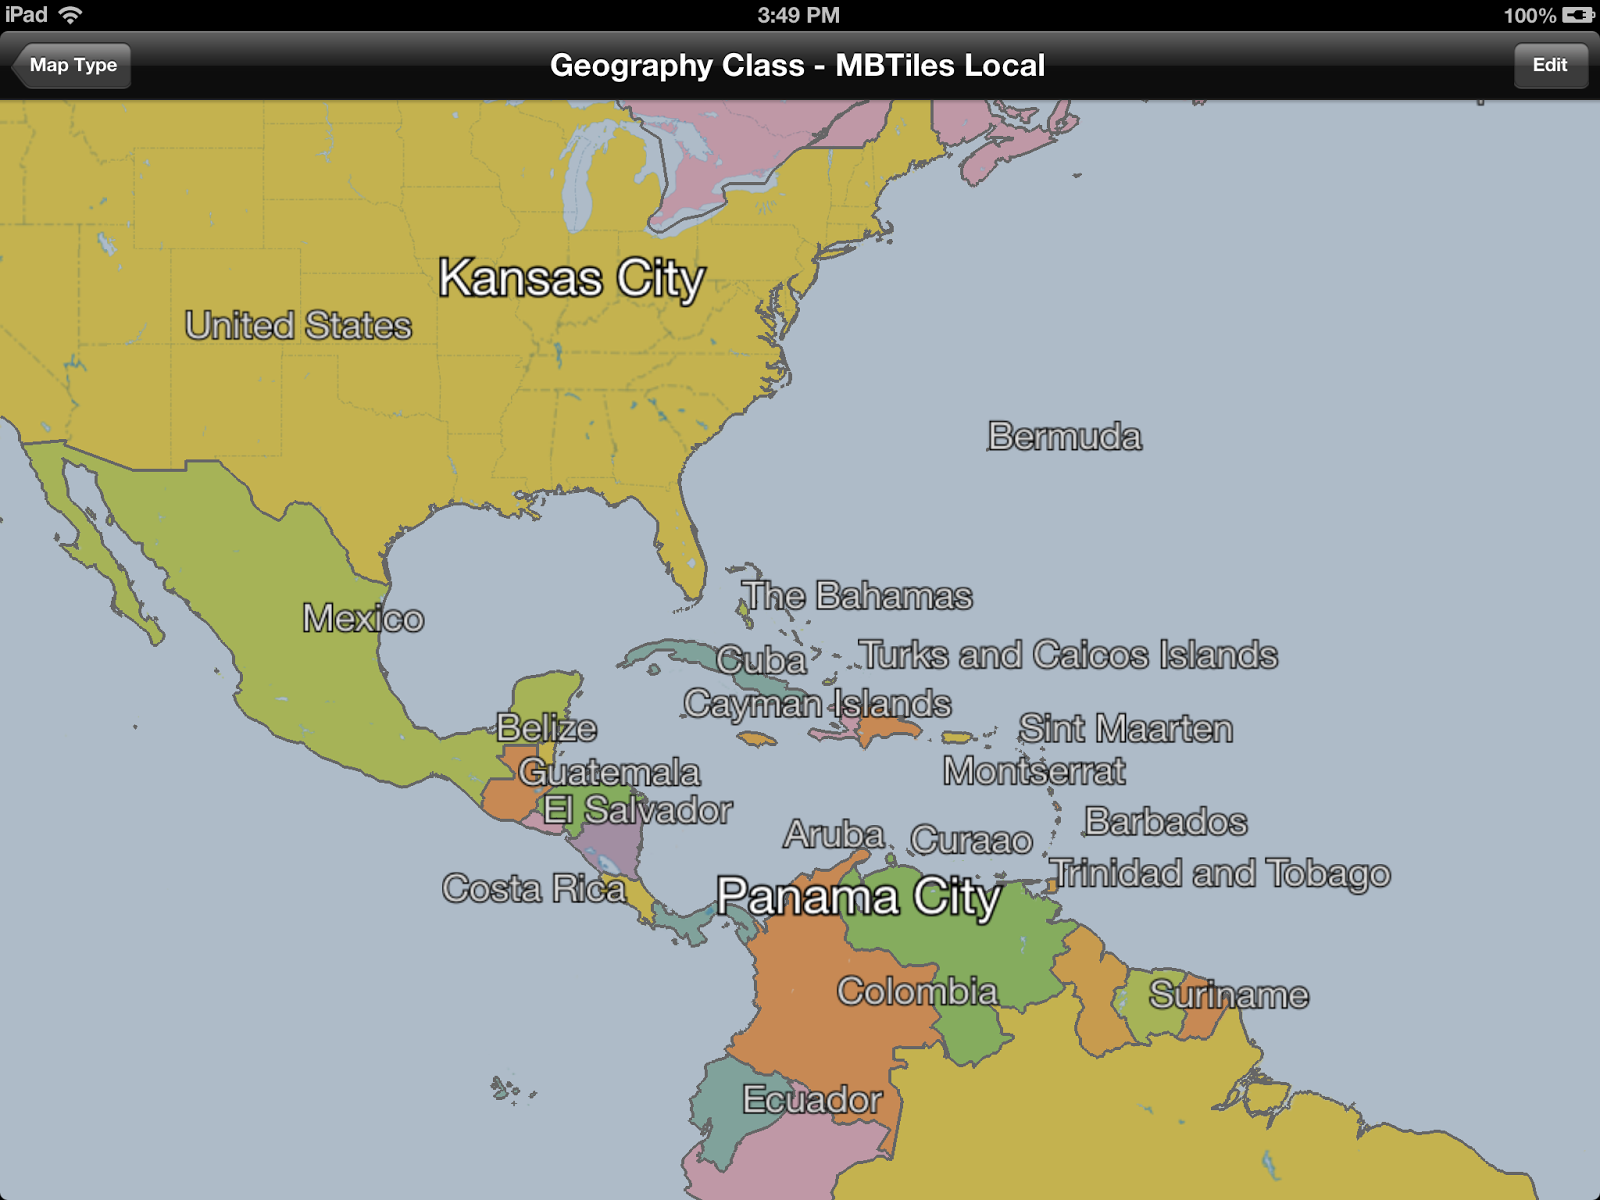
Labels now support a wider range of features, including an outline color and size. That's nice for maps with cluttered backgrounds.
The layout engine is a bit more sophisticated as well. It can handle rotation and does a better job with justification.
Vectors & Lofted Polygons
The toolkit can now tesselate large, weird polygons. Why? Because sometimes you get large, weird polygons.
 |
| Oh goodie, lakes. |
This is useful in a couple of places. First, the
kMaplyFilled attribute works a hole (pun intended) lot better on vectors. Second, the lofted poly layer is a lot faster. Tapping Russia is now interactive.
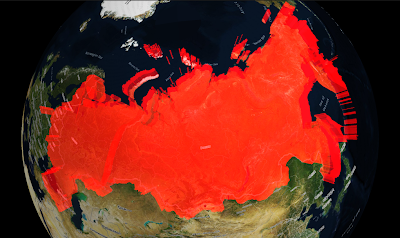 |
| Ha ha. Red. I get it. |
Thread Control & Active Objects
Now for the obscure stuff. You can add things on the main thread! Gasp! Wait. What?
 |
| That little sphere is moving. Just keep staring. |
WhirlyGlobe-Maply likes its threads, it uses a bunch of them. We try to do everything on either the
layer thread or in custom dispatch queues.
Well great, but what if you want to change something RIGHT NOW. You know, if you're editing it. Or maybe animating it. Now you can.
All the usual add calls (i.e.
addScreenLabels:) take a
mode: parameter. Right now the mode is either
MaplyThreadAny (the old way) or
MaplyThreadCurrent. For the latter we do the deed right now on the thread we're currently in.
There's also a new
MaplyActiveObject, which is wrapper around a callback you get right before the next frame draws. This is how you animate if you're so inclined. Use it wisely.
Screen Space Calculation & Tilt
The toolkit spends a lot of its time trying to figure out what to load and when to load it. It does this by deciding how big things are on the screen. That works fine if you're staring straight down, it gets trickier if you're not.
Crazy! Who knew? Well I knew, I was just avoiding it.
And now I'm not avoiding it. We can display the sampled curved surface of a globe when looking outward. That was fun.
You can mess with the
tilt in a
WhirlyGlobeViewController. This can get tricky, so check out the
setTiltMinHeight:maxHeight:minTilt:maxTilt: method. That'll muck with the tilt as you get close to the ground in a somewhat intuitive fashion.
Maply (2D) Changes
Support for the 2D/3D map mode is fleshed out a bit more. I think you can actually use it for apps now, because... well... I have.
 |
| Like a Globe, only Flat. |
There's a true 2D map mode now, where you can turn off lighting and even tie the map to a UIScrollView. It's a bit... tricky yet.
The gestures could use a bit of work and I'm getting a better idea of what users might want (hint: looks like MapKit). There will probably more of this in 2.3.
Component vs. WhirlyGlobe-Maply API
I used to stress the difference between the low level WhirlyGlobe-Maply API and the high level Component. The API uses a combination of C++, STL, Boost, and apparently MADNESS. I'm just pushing the WhirlyGlobe-Maply Component these days.
In fact, most of my clients are using the Component, so all the good stuff gets exposed there. Point being, just use the Component.
Other Stuff
There's a lot of new functionality in WhirlyGlobe-Maply 2.2. Did I mention custom shaders? I did not. The low level rework that'll make Android porting easier? Didn't really go into that. How about elevation data? Yeah, it's there, but you need your own data. Don't have that... let's wait until 2.3.
And, oh yeah, the WhirlyGlobe-Maply Component Tester app has been heavily reworked to show all this off. Check that out for examples.
The Future
I'm putting 2.2 into Beta shortly. It'll go active on the main branch on github, then we'll update the pod specs, the documentation, and the binary distribution.
After 2.2 I'm looking more toward map related features. The globe is fun, but maps (vector and image) are a bigger user base. Rather than crazy high end stuff (which my clients like), I need to put some time into making things easier to use. Annotations are an obvious problem, as is area based update.
Of course, clients pay the bills, so expect more high end craziness as well.