Showing posts with label CartoDB. Show all posts

Thursday, November 20, 2014

CartoDB Layer Tutorial

CartoDB is pretty awesome for building interactive apps that need spatial data.  Most of these are web apps, but you can use CartoDB on mobile too.

Probable bed bug infestations in Manhattan

Frankly, there aren't enough mobile apps using WhirlyGlobe-Maply and CartoDB.  So I wrote a tutorial.

CartoDB Tutorial


We've got a brand new set of tutorials up on the brand new WhirlyGlobe-Maply web site.  They'll run you through setup all the way to vector selection and beyond.

The CartoDB Tutorial is one of the cool ones.  We use a MaplyQuadPagingLayer to fetch New York PLUTO data for Manhattan.

The paging layer does the dirty work of figuring out which tiles are visible.  We add a little code to fetch the data in a given tile and then display it.  The toolkit does the rest.

Synergy


It wasn't all that hard to put this together.  If you know CartoDB, you won't have much trouble using WG-Maply.  If you know WG-Maply, adding the CartoDB piece is a cinch.

I'd like to see more CartoDB based mobile apps out there.  Don't make me write them all myself.

Friday, March 21, 2014

WhirlyViz 1.2 - Update

The latest WhirlyViz is on the app store.  It's a bit faster, more reliable and has better navigation, particularly for the phone.  But most importantly, there's new functionality.

San Francisco is very brown today
If you're just tuning in, WhirlyViz is a geospatial display app for iOS which I've discussed before.  It's based on client projects and a few of my own.  One of those was.....

TransitVis


The TransitVis app was an experiment and an entry for a hackathon.  It was a great way to work through some data viz issues without a client breathing down my neck.  We can now duplicate the TransitVis app with a configuration file.

Like many of the other examples, I'm using CartoDB on the back end.  When the user changes parameters or taps on a data value it's sending off a SQL query.

The 14 isn't transit, it's dinner and a show.

Election Map


Everyone needs an election map!  With the 2014 midterms coming up, I'd love to see some WhirlyViz based election maps in prominent apps.  And if not, there's always 2016...

The only time Ross Perot is described as "pretty".

I put this one together from county census voting data from 1980 to 2008 and used the Purple America algorithm to get some nice blended colors.  The 1992 election is interesting since there was a third party candidate and you get some green.

Next for WhirlyViz


Demos, demos, demos.  More demos is the main thing.  I'm lining up a few with collaborators rather than writing any more of my own.

I've also been experimenting with Javascript in the configuration files.  I like it!  There will be more of that.

Thursday, February 27, 2014

WhirlyViz Demo

The other day I was planning to give a short talk on WhirlyViz at the San Francisco GeoMeetup.  Due to equipment problems it never happened.

Rather than let slides go to waste, here's the talk in video form.


You can get WhirlyViz on the app store.

The URLs I use as examples can be found in a previous blog post.

Tuesday, February 25, 2014

WhirlyViz - A Quick Introduction

A few weeks ago we put together an app called WhirlyViz.  And then I got busy with other things.  Android and vectors maps, if you're curious.
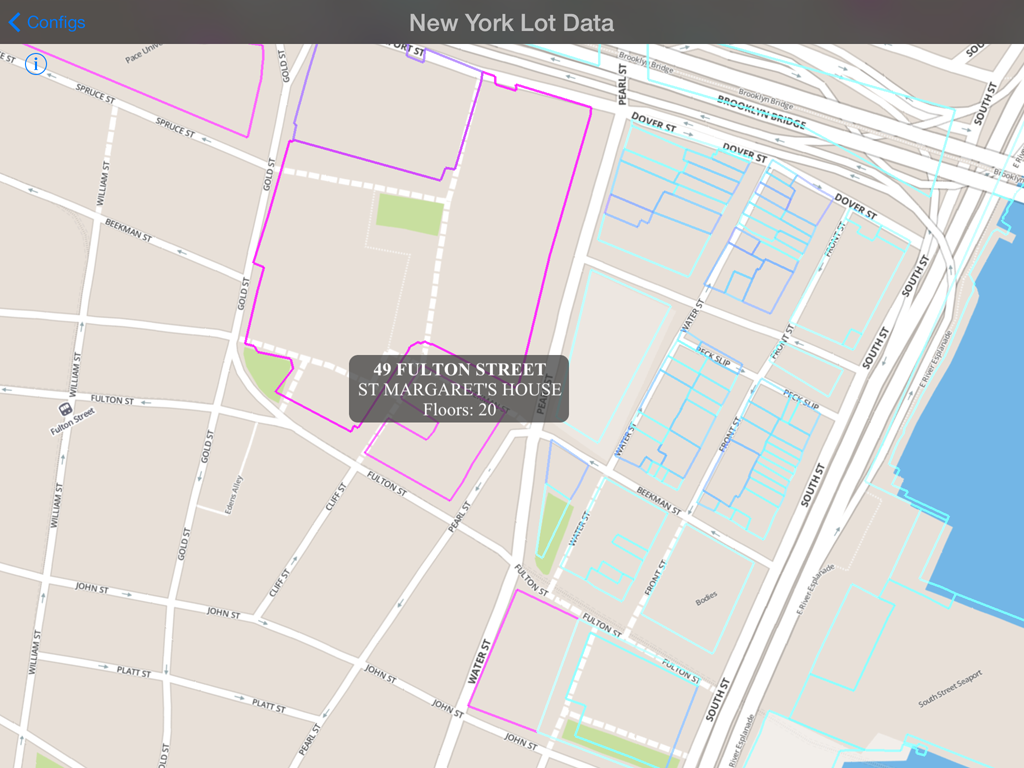
Property in New York that you do not own.  Nor I.

What is WhirlyViz?


WhirlyViz is a geospatial display app for iPhone and iPad.  It displays data, like vectors and maps, in relation to each other.  Then it lets users interact with the data.  Oh, and it's free.

It's an outgrowth of client and user projects.  A lot of my users slap a few vectors on top of a base map and then let the user tap on them.  I figured I could automate that case.... as well as some more interesting ones.
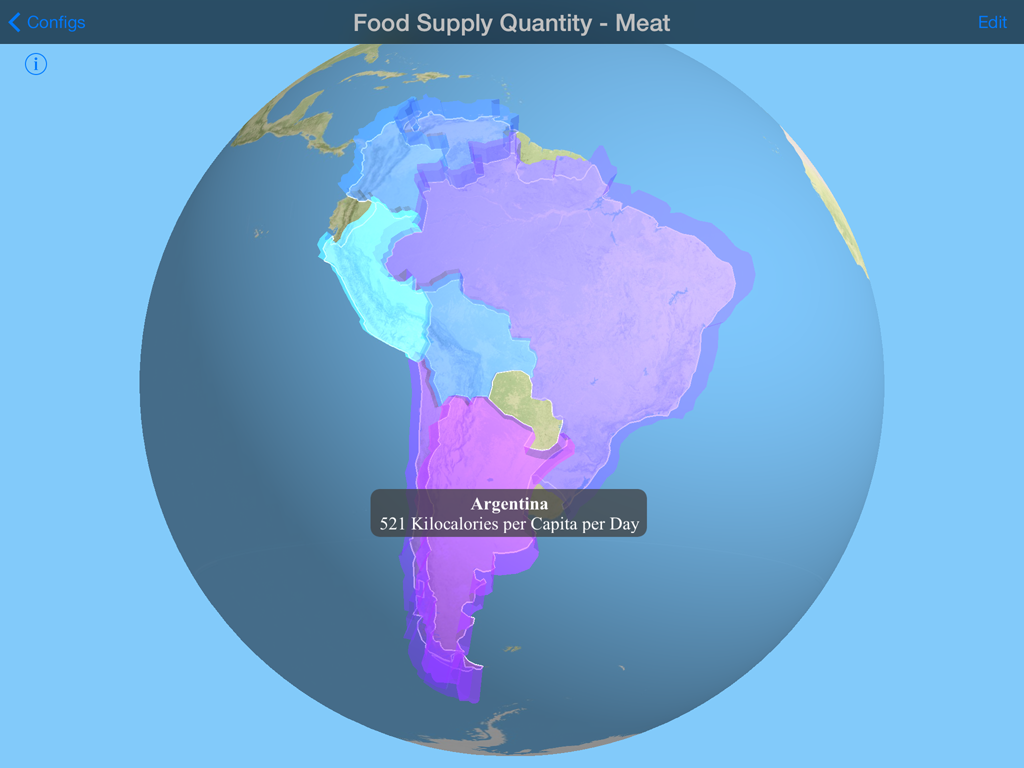
Seriously, there's a country that eats a lot of meat.

I'm not ready to roll out the complicated cases yet.  They get complicated.  But the simple cases are ready to go.

GeoJSON Overlay in WhirlyViz


Ever wanted to display a GeoJSON file on your iPad?  Yes, you could use Leaflet and Safari.  Ever wanted it to be fast and not annoying?  Well, I can hook you up.
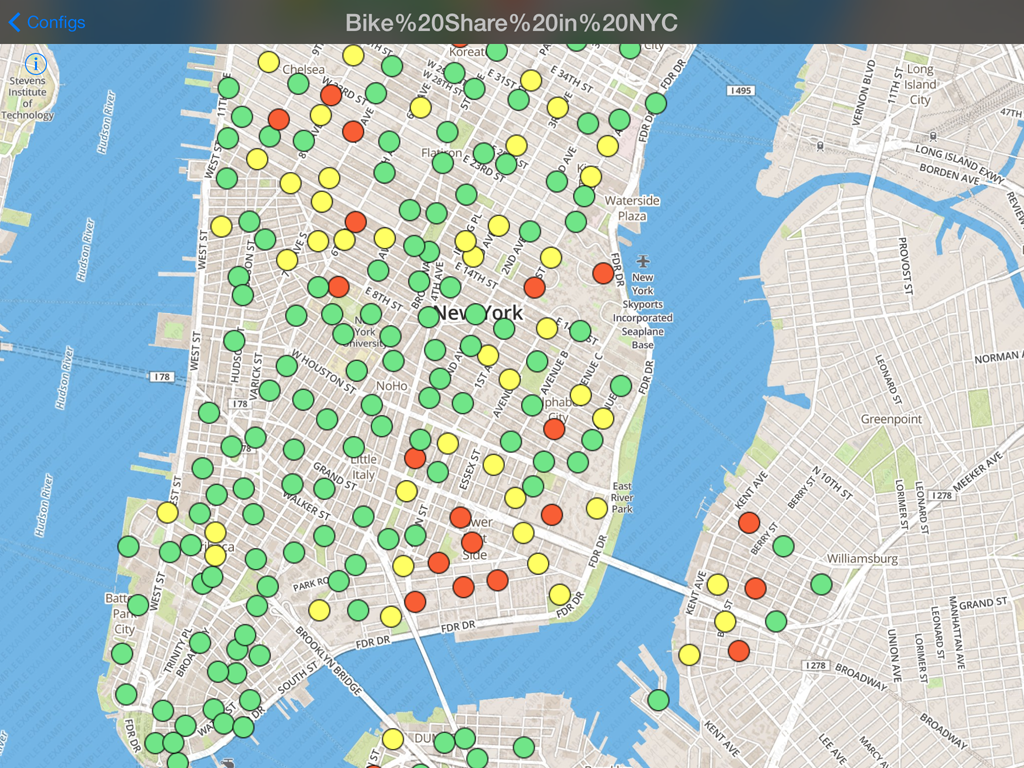
Dude, I could have totally had a bike, like, two years ago.

That's an incredibly old snapshot of New York bike share availability.  It's just a GeoJSON file slapped on top of a standard MapBox basemap.

And you can make these yourself!  It's actually quite easy.  First, some examples.

WhirlyViz URL Examples


First off, you need to install WhirlyViz on your iPad or iPhone.  Go ahead, I can wait.

Now come back to this page in Safari and click on the links below.

  Chicago zip codes displayed in red on a globe

  Chicago Zip Codes 

  Country-like regions from Natural Earth Data

  Admin 0 boundaries (sort of countries) from NaturalEarthData

  An example with a handful of bars in Washington, DC using icons

  Bars in Washington, DC

  A snapshot of city bike share stats from New York also using icons

  BikeShare in New York, NY

Load up any of these and tap on the vectors.  You'll see the attributes on the GeoJSON data.

Anatomy of a WhirlyViz URL


Did you know you could make custom URLs for iOS apps?  Well you can.  Developers do it all the time.  All WhirlyViz URLs start out like so:

That tells iOS we want to invoke WhirlyViz and it tells WhirlyViz to get ready to display something.  Then we have a bunch of arguments.
  • name=<name>   The display name the user sees up top.
  • basemap=<url>  The json file describing the basemap we'd like to see
  • geojson=<url>    A GeoJSON file to slap on top of the basemap
  • type=<globe/map2d>  Whether we want a 2D map or a 3D globe
  • vecwidth=<width>      Width of any following vectors
  • veccolor=<hex color>  Color of any following vectors
  • vecfilled=<yes/no>      Whether or not vectors are filled
  • clearcolor=<hexcolor> The background color for the globe

The Chicago zip code example is constructed like this.

And here's what it's doing:
  • Puts the name "Chicago Zip Codes" up top.
  • Tosses down an example MapBox basemap.
  • Puts up a zipcode GeoJSON file with vector outlines in red.
  • Puts up the same zipcode file with translucent red filled polygons.

You can make those yourself.  It's really not that hard.  I like to construct them in email and mail them to myself on the device.

Future of WhirlyViz


On the complicated side, there's a lot to do.  WhirlyViz has some crazy features that'll take a while to shake out.  Some actual clients using it might be nice.

On the simpler side, I'm happy to add features to the GeoJSON display.  The styles github supports would be a good start.  Just try it and let me know what you did!

Monday, June 17, 2013

CartoDB Example

I whipped up a guest blog post over at the CartoDB blog.

France!
That's a simple app that queries country outlines from their spatial database service.  Lot of interesting possibilities there, go check it out.