Showing posts with label WhirlyGraph. Show all posts

Thursday, February 27, 2014

WhirlyViz Demo

The other day I was planning to give a short talk on WhirlyViz at the San Francisco GeoMeetup.  Due to equipment problems it never happened.

Rather than let slides go to waste, here's the talk in video form.


You can get WhirlyViz on the app store.

The URLs I use as examples can be found in a previous blog post.

Tuesday, February 25, 2014

WhirlyViz - A Quick Introduction

A few weeks ago we put together an app called WhirlyViz.  And then I got busy with other things.  Android and vectors maps, if you're curious.

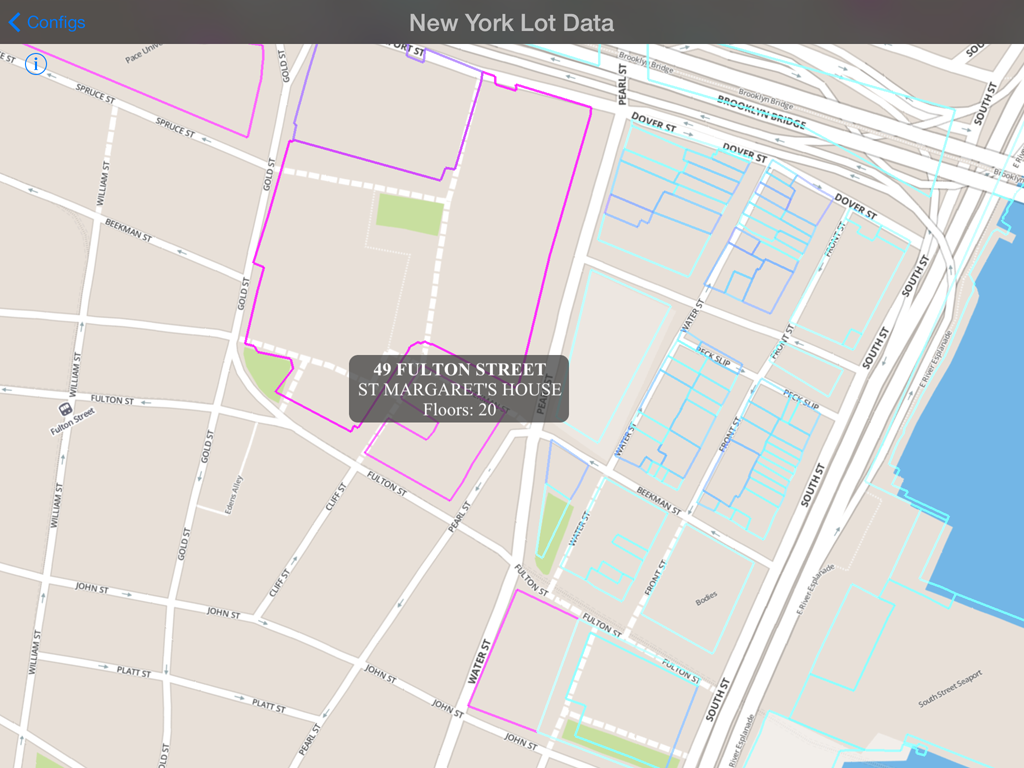
Property in New York that you do not own.  Nor I.

What is WhirlyViz?


WhirlyViz is a geospatial display app for iPhone and iPad.  It displays data, like vectors and maps, in relation to each other.  Then it lets users interact with the data.  Oh, and it's free.

It's an outgrowth of client and user projects.  A lot of my users slap a few vectors on top of a base map and then let the user tap on them.  I figured I could automate that case.... as well as some more interesting ones.

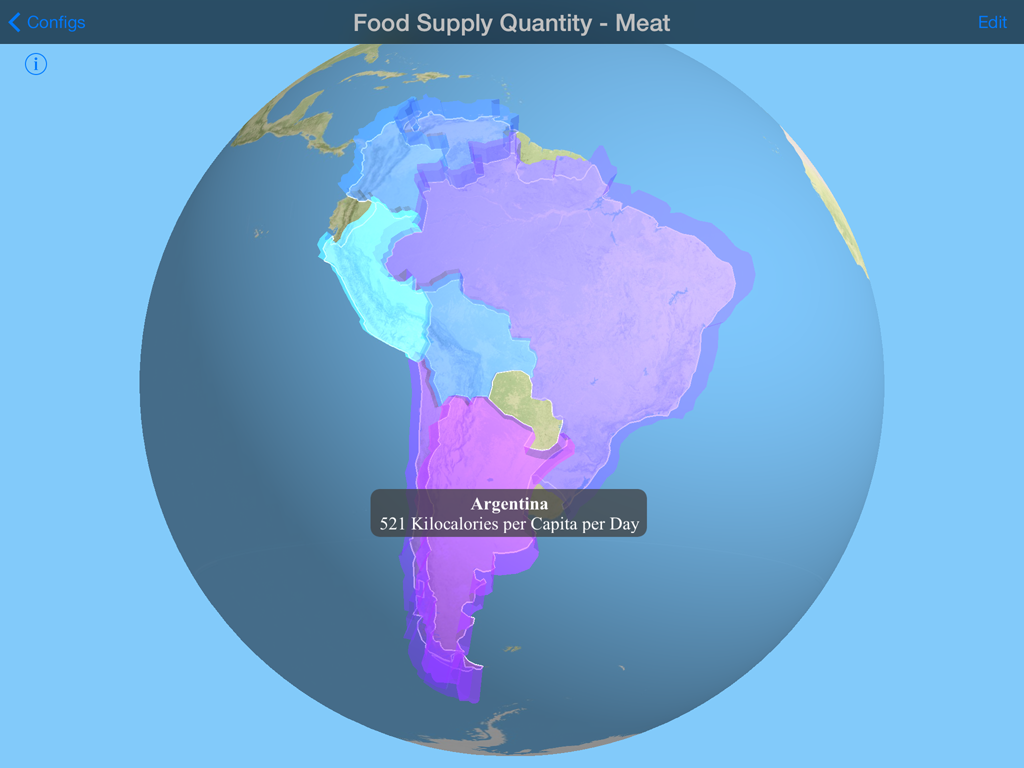
Seriously, there's a country that eats a lot of meat.

I'm not ready to roll out the complicated cases yet.  They get complicated.  But the simple cases are ready to go.

GeoJSON Overlay in WhirlyViz


Ever wanted to display a GeoJSON file on your iPad?  Yes, you could use Leaflet and Safari.  Ever wanted it to be fast and not annoying?  Well, I can hook you up.

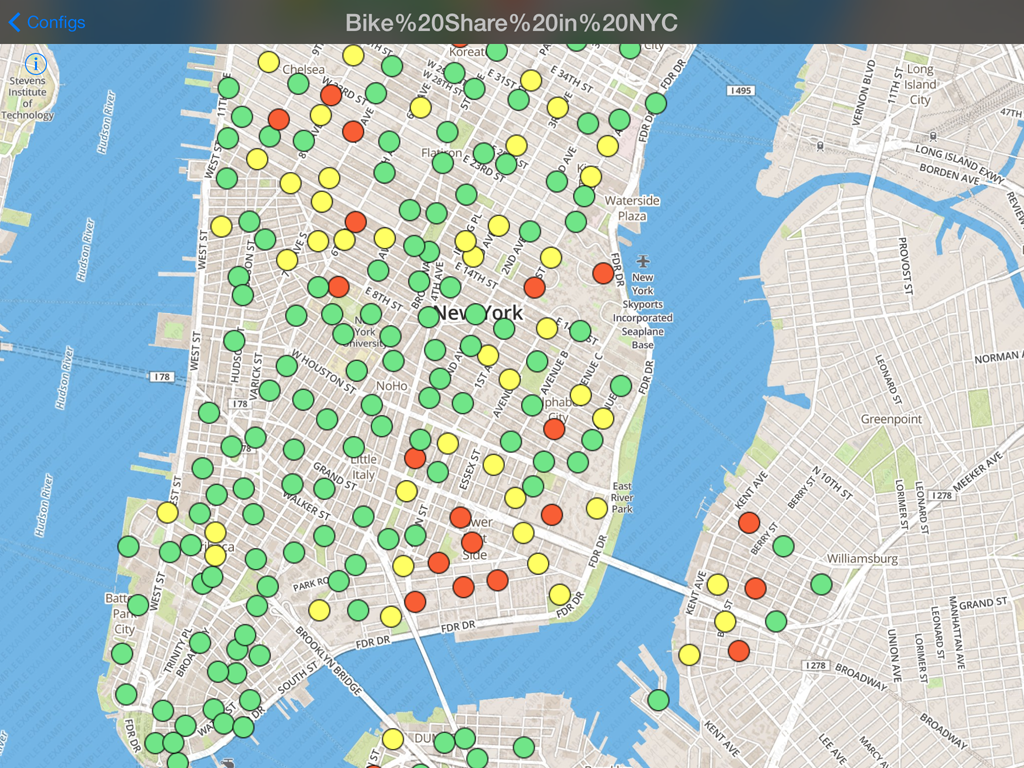
Dude, I could have totally had a bike, like, two years ago.

That's an incredibly old snapshot of New York bike share availability.  It's just a GeoJSON file slapped on top of a standard MapBox basemap.

And you can make these yourself!  It's actually quite easy.  First, some examples.

WhirlyViz URL Examples


First off, you need to install WhirlyViz on your iPad or iPhone.  Go ahead, I can wait.

Now come back to this page in Safari and click on the links below.

  Chicago zip codes displayed in red on a globe

  Chicago Zip Codes 

  Country-like regions from Natural Earth Data

  Admin 0 boundaries (sort of countries) from NaturalEarthData

  An example with a handful of bars in Washington, DC using icons

  Bars in Washington, DC

  A snapshot of city bike share stats from New York also using icons

  BikeShare in New York, NY

Load up any of these and tap on the vectors.  You'll see the attributes on the GeoJSON data.

Anatomy of a WhirlyViz URL


Did you know you could make custom URLs for iOS apps?  Well you can.  Developers do it all the time.  All WhirlyViz URLs start out like so:

That tells iOS we want to invoke WhirlyViz and it tells WhirlyViz to get ready to display something.  Then we have a bunch of arguments.
  • name=<name>   The display name the user sees up top.
  • basemap=<url>  The json file describing the basemap we'd like to see
  • geojson=<url>    A GeoJSON file to slap on top of the basemap
  • type=<globe/map2d>  Whether we want a 2D map or a 3D globe
  • vecwidth=<width>      Width of any following vectors
  • veccolor=<hex color>  Color of any following vectors
  • vecfilled=<yes/no>      Whether or not vectors are filled
  • clearcolor=<hexcolor> The background color for the globe

The Chicago zip code example is constructed like this.

And here's what it's doing:
  • Puts the name "Chicago Zip Codes" up top.
  • Tosses down an example MapBox basemap.
  • Puts up a zipcode GeoJSON file with vector outlines in red.
  • Puts up the same zipcode file with translucent red filled polygons.

You can make those yourself.  It's really not that hard.  I like to construct them in email and mail them to myself on the device.

Future of WhirlyViz


On the complicated side, there's a lot to do.  WhirlyViz has some crazy features that'll take a while to shake out.  Some actual clients using it might be nice.

On the simpler side, I'm happy to add features to the GeoJSON display.  The styles github supports would be a good start.  Just try it and let me know what you did!

Thursday, February 21, 2013

The Return of Lofted Polygons

You know that one feature? The one you implement right near the beginning of your work; that you come to regret almost immediately, but can't get rid of? This is that feature.

Africa has the best looking stats.

Yeah, that.  Looks great, doesn't it?  I hate it.

I whipped up lofted polygons at a hackathon several years back and everyone's loved it since.  We won a prize, because... c'mon, I'm a professional consultant who specializes in mobile 3D.  It's hardly even fair.

This feature has been my computational portrait of Dorian Gray.

Why Lofted Polys are so Slow


Because math.  Check this out.

Geez, Canada.  What is that?  One vertex per resident?

And remember, this is on an iPad.  When the user taps, something needs to happen within a few frames.  So what's the answer?  Well, you save the expensive representation out to storage.  You cache.

I've had caching for lofted polys at the WhirlyGlobe API level for a while, but it was ugly.  This is a display toolkit and unexpectedly writing things to storage is not particularly welcome.  When the Component came along, I just buried the feature.

Lofted Polys in the WhirlyGlobe-Maply Component


Now lofted polys are back and here's how they work.  There are a couple of new methods on the view controller.

/// Color
#define kMaplyColor @"color"
/// Height above the ground
#define kMaplyLoftedPolyHeight @"height"
/// Boolean that turns on/off top (on by default)
#define kMaplyLoftedPolyTop @"top"
/// Boolean that turns on/off sides (on by default)
#define kMaplyLoftedPolySide @"side"

/// Add visual defaults for the lofted polys
- (void)setLoftedPolyDesc:(NSDictionary *)desc;

/// Add one or more lofted polys.
/// If you pass in a vector database, we'll attempt to cache
///  the generated data with 'key' for speed.  The vector database should
///  be where the polys originated.  nil is acceptable for both key and cacheDb.
- (MaplyComponentObject *)addLoftedPolys:(NSArray *)polys key:(NSString *)key cache:(MaplyVectorDatabase *)cacheDb;


The comments say it all.  There's the lofted poly description dictionary with which you can supply height (in display units), turn off top and sides and assign color.  Then there's the add call and that's where the caching comes in.

If your vectors came from a MaplyVectorDatabase (probably a shape file), then you can cache the lofted polys back to that database.  For shapefiles, that just means a bunch of .loftcache files with the same name.  You'll also need to provide a unique string key for the cache.  I use the admin attribute for countries, but you can make something up.

Here's what all that usually looks like.

[viewC setLoftedPolyDesc:@{kMaplyColor: [UIColor colorWithRed:1.0 green:0.0 blue:0.0 alpha:0.25], kMaplyLoftedPolyHeight: @(0.05)}];
MaplyComponentObject *compObj = [baseViewC addLoftedPolys:@[vecObj] key:countryName cache:countryDb];
[viewC setLoftedPolyDesc:@{kMaplyColor: [NSNull null], kMaplyLoftedPolyHeight: [NSNull null]}];

That's basically it.  It's up to you to make up a key.  If you want to skip caching, just pass nil into key and cache.

What's Next


That's the last high level feature I needed to expose to the WhirlyGlobe-Maply Component (it works in the flat map too).  There are a few low level features, like active models, but I'm not going to expose those in the Component.  That's crazy stuff used by crazy people.

This is checked into the develop branch on github.  If you want it right now, go get it.  If not, there will be a binary beta distribution for WhirlyGlobe-Maply 2.1 along soon.
Tuesday, April 10, 2012

WhirlyGlobe & CartoDB

WhereCamp 2012 was pretty small this year, I'm told, but the quality was high.  I ran into a few people doing some very interesting things.  One of those people was Javier de la Torre of Vizzuality.

Vizzuality just launched CartoDB, which is a cloud based GIS database and processing system based on PostGIS.  Sort of a dynamic back end for map data dependent applications.

CartoDB Demo

Displaying vector data is one of WhirlyGlobe's big strengths.  Images are fine, but you just can't beat vectors for most things, particularly in 3D.  Much of the web mapping world is focused on image tiles so it's nice to run into people who get vectors.  Here's a quick demo app we put together.

Protected areas organized by country.
In the picture above, we've fetched UN recognized protected areas, such as parkland, for the selected countries.  The result is colored according to its associated country code.  Apparently Germany is big on parkland.

This sort of thing is more fun if it's interactive, so here's a video.


Anatomy of a Demo

Building the demo itself was pretty easy.  I started with the WhirlyGraph app which is checked in to the Contributed area in WhirlyGlobe.  That app lets you select countries of interest and show various statistics as candy colored polygons floating above the terrain.

I turned off the basic stats display functionality and substituted a query to CartoDB.  Here's an example for Columbia:
http://viz2.cartodb.com/api/v2/sql?q=select name,desig,gis_area,iucn_cat,ST_Simplify(the_geom,0.01) as the_geom from wdpa_2012 WHERE country='COL' AND gis_area > 10.0000&format=geojson

The salient parts of the URL are like so.

  • It's an SQL query, returning the fields: name,  desig,  gis_area, iucn_cat, and the geometry.  Those are all derived from fields in the original table.
  • The data is coming from the dataset wdpa_2012.
  • Rather than return the raw geometry, it simplifies it a bit first.  Very nice for display.
  • We filter by country code (COL) and polygons with a gis_area greater than 10.  This gets rid of the really small data.
  • The return format is GeoJSON.  Human readable if you want to take a look.

Once the query comes back, I process it with the world's dumbest GeoJSON parser and toss the results into a lofted poly layer.  Because that looks pretty.


Conclusions

It took an hour to put together the initial demo.  I spent a couple more hours making it a bit more friendly.  A shippable app would take longer, of course, and I'd want to look at data sizing issues.  Big queries are going to be slow and take a while to display.  A user would probably want more immediate feedback.

CartoDB was nice and easy to use.  The returns were more or less what I was expecting and tweaking the query was quite easy if you have a GIS background.  I could see making some interesting apps with this.