Showing posts with label ipad. Show all posts

Friday, January 11, 2019

Saildrone Forecast

Is there anything cooler than shipping an app you've spent a year and a half working on?
It was a rhetorical question.  There is not.


Saildrone Forecast

Hint: It's a weather app.

Saildrone Forecast


Yup, Saildrone Forecast is a weather app.  Just watch the video.


Go download it.  I'll wait.

Technical Bits


There's a ton of stuff in Saildrone Forecast that's unique.  But there are a couple bits of interest in WhirlyGlobe-Maply itself, like the new sampler/loader architecture and offscreen render targets.  Go watch the video.


Could you make your own weather app out of the box now?  Ha ha.  Oh god no.  There's so much other stuff to do.  Not to mention the data.  But there are cool things to do with the vector maps and render targets.

Acknowledgements


I didn't do this all alone.  Heck, I didn't even write the whole app. 

Credit goes to Logical Animal for the rest of the UI.  Big thanks to the meteorology/modeling team at Saildrone for the data and putting up with stupid questions.  Thanks to the platform developers and ops for processing data and keeping it running.  And, of course, management and finance upon whom I can bestow the greatest contracting honor:  They always pay early.

Tuesday, April 25, 2017

Data Paging Layers

We load a lot of data sources in WhirlyGlobe-Maply, usually over the network.  Images are relatively easy, but how do you deal with things like vector tiles?

Ye olde vector tile example

That would be the job of the Paging Layer.

Quadtree Structured Data Paging


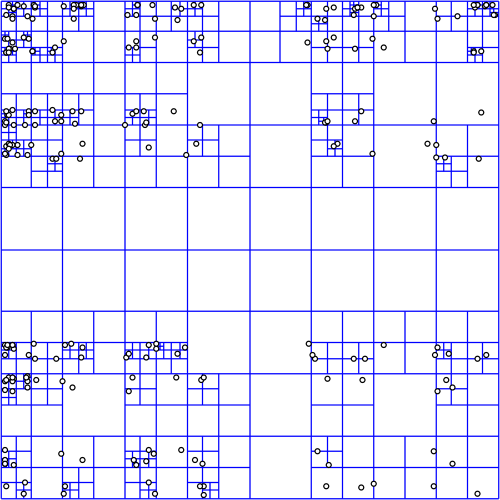
It all starts with a quadtree, a simple enough data structure.  It's here that we decide what's visible and what needs to be loaded.

Quadtree courtesy wikipedia
The quadtree for a data source can be in any proj.4 supported coordinate system, but most people use Spherical Mercator which is... what they use.  No judgement.

In deciding what to load, we start at the top node (0: 0,0), projecting a box into the view and then recursing if the box is visible.  It's not all that expensive, because quadtree.  But does get a bit tricky when using the globe or multiple coordinate systems.


For image layers, the toolkit has its own complex logic for loading image tiles and frames and handling failure and so on.  We provide similar logic for vector tiles, but for anything else, the logic is you.

Quad Paging Layer


You've got a data source, sqlite file full of points, let's say.  You want to turn them into markers, but there's too many to load at once.


Here's where the QuadPagingLayer (Android) or MaplyQuadPagingLayer (iOS) comes in.  Set up one of these babies with the coordinate system and extents of your data source and it'll figure out what to load.

You have to create the visible objects and that's where the PagingInterface (Android) and MaplyPagingDelegate (iOS) come in.  The paging layer calls you back when it's time to load a tile's worth of data.

Mt. St. Helens LIDAR
We love our threading in WhirlyGlobe-Maply and it was ever so hard to implement.  So use it.  Try a dispatch queue on iOS or use a worker thread on Android.  But don't hold up the paging layer.  It has other things to do.

When you make a visible object (marker, label, etc) tell the paging layer what you created with the addData (iOS, Android) method and call tileDidLoad (Android, iOS) when you're finished.

That's enough information for the paging layer to do the rest, which includes...

Cleanup on Node (12: 129,1304)


One of the trickier bits here is deciding when to delete something.  Luckily, you don't have to.

You told the paging layer what you created and it'll delete it for you.  There's even a callback if you really, really want to know it did that.

Paging Layers are Awesome


There it is, one of the key pieces of WhirlyGlobe-Maply: the paging layer.  We use it all over the place and if we don't support your data type, you'll use it too.

Tuesday, February 21, 2017

Styled Layer Descriptor and Metro Extracts

In WhirlyGlobe-Maply 2.5 we added support for the Styled Layer Descriptor format.  We also added an example in the AutoTester and a tutorial.

Belfast, it seems.

Let's start with the data.

Metro Extracts


Mapzen provides regular extracts of OpenStreetMap data.  These are available in a variety of formats; useful if you just want a little OSM data.

Courtesy Mapzen

We chose Belfast in GeoJSON for our own example.  This is just data, though, so how do we make it visual?

Styled Layer Descriptor


The Styled Layer Descriptor format is an OGC standard used to style data into map images.  It's a bit crusty but, you know, standard.  We edit it in QGIS and export it for use in our toolkit.


WhirlyGlobe-Maply reads SLD and uses it to style Shapefiles, GeoJSON, or Mapbox Vector Tiles.  Any vector data, basically.  So let's put it all together.

Example & Tutorial


Rather than blather about it here, we put a nice example in the AutoTester app for iOS.  In Swift!

Ranen put together a tutorial that walks you through the process.  You can start with a Metro Extract and modify the SLD styles to your heart's content.

Up Next


We're picking up SLD users for the toolkit at a steady clip.  There's a lot more to SLD we could support, so let us know how you like it.

We'd also like to circle back and improve the Mapbox GL Style Sheet support and implement Mapzen's Tangram format.  But we need customers for those.  Speak up if you're interested.

Thursday, February 2, 2017

WhirlyGlobe-Maply 2.5 Release

Version 2.5 is out for both iOS and Android.

Location Tracking

You can get v2.5 off of the build page or from the master branch.  We'll update the master Podspec for Cocoapods soonish.

As usual, getting this version out the door took way too long.  But here it is and it's really good.

Big Changes in Version 2.5


Android.  Without a doubt.  We now have a good Android version with a bunch of deployed Android apps.  Millions of people are using WhirlyGlobe-Maply on Android.  Crazy, right?

We started doing automated builds.  I can't over stress how useful those have been.

Both iOS and Android have AutoTester apps; individual test cases presented in a list format.  Useful both for testing and user examples.

We upgraded to Swift 3.0 and kept pace with all the new Xcode versions and UIKit deprecations.

Ripped out AFNetworking and Boost.  Respect to both packages, but AFNetworking was interfering with users' own version and we eliminated Boost with C++11.

Vector (tiled and not) support got fancier with Styled Layer Descriptor format and the Simple Styles approach for building your own.

True 3D interaction got fancier in support of LIDAR.  There's an example in the AutoTester so check it out.

We added user location tracking and display.  A relatively simple change, but a popular one for map users.

Important but Boring Stuff


We made an enormous number of small fixes, efficiency improvements and minor functionality tweaks.  Also a lot of new tests for things that are (no longer) broken.  Here's a partial list in a boring format no one is going to look at.

Maps now have ViewState animations like the globe.  Feature selection is smarter with individual and group features.  Widened vectors is faster, smaller, and better.  We've got a 3D model builder for things like airstrips.  Elevation support is better and more flexible.  Stars and atmosphere work better.  Vector tiles kept up with new versions and added more style options.  Particle systems work better.  Internal coordinates are now double everywhere for getting really close to things.  3D support includes the ability to "grab" objects via the IntersectionManager.  Removed Mapbox GL Style Sheet support and then put it back.  Single level loading works on the globe now for both vector and image layers.  Screen Label layout works correctly for all modes.  Great circles work in 2D across the date line.  And much, much more.

What's Next


We're going to make some internal changes to the source tree, like unify the Android and iOS branches.  Then we'll move to git-flow methodology to hopefully speed up minor releases.

In terms of functionality, I've been rolling out statements of intent for things like Windows, True 3D support, MapKit, and Mapbox support.  We've also got the Imagery Pro toolkit for weather apps and another one in the pipeline.  Much of this requires money, so let me know if you have some.

Monday, December 5, 2016

Part 1: Existing 3D Support in WhirlyGlobe-Maply

We've got a two parter for you.  First up we'll look at the existing 3D support in WhirlyGlobe-Maply.  Next time we'll lay out the roadmap for 3D in the future.

So let's start with the question:  Isn't WhirlyGlobe-Maply already 3D?

3D Minus 1D Equals 2D


Everything WhirlyGlobe-Maply does is 3D, but we hide it most of the time.  Look at some of the more prominent apps, even ones that use the globe.

Dark Sky, Gaia GPS, NatGeo World Atlas

The giveaway is the gestures.  Can you tilt?  Nope.  And we're not hiding some wealth of information.  If you did tilt toward the horizon you'd see.... nothing much.

To be truly 3D an app needs to turn on the 3D gestures and it needs data with real 3D structure.  There are a few that do it and we provide a lot of functionality to support them.

LIDAR Point Clouds


Did you know WhirlyGlobe-Maply supports LIDAR in a pageable sqlite format?  It does and it's pretty cool.


Available on both iOS and Android in 2.5 this is an essential use of 3D.  You couldn't see all that much in 2D... well okay you can, but it's better in 3D.

Truly 3D Terrain


We've been able to do true 3D terrain for years.  Aviation apps use it.

FlyQ EFB Synthetic Vision Mode

Why don't you see that more?  Well, it's useful for aviation and.... um, games maybe?  Users tend to be specialized.

Models, Markers, Billboards, Labels & Lines


The toolkit can display 3D models in Wavefront OBJ, a data format old enough to vote, but it works well enough.

We can also do billboards, which are like a 3D version of markers and, of course, labels.  Here's what you'd use that for.

NATS Airspace Explorer


Inspired to make your own 3D traffic app?  Of course you are, but it's a lot of work to get the display right and the data is expensive.

General 3D Geometry


Lots of our users make stuff up on the fly.  Why?  Because if there was a pre-packaged version of it, they wouldn't be making an app.

Fake airstrips are fake.  Do not try to land.

For stuff like this we've got a model generator.  You build up your special snowflake of a model polygon by text by line as needed.

If you've already got 3D geometry, you can hand the triangles over to the renderer.  Hard core, but useful in a few cases.

Lofted Polygons and Extrusions


On the easier side are a couple of features that let you think in 2D and tack on a height.

Downright candy colored

Lofted polygons have been around a long time and work well on the globe.  They're nice for showing relative height... and they just look cool.

Extrusions are a way of whipping up a model without having to do, like, math.  You can slap together an arrow, for example, to point at things.

Where We're Heading


WhirlyGlobe-Maply has extensive 3D support and real apps (mostly aviation) have been using it for years.  It's all rather do-it-yourself though, particularly on the data side.

There are a number of good data sources for 3D coming on line recently.  In the next post we'll discuss how we'd like to use them and where we'd like to go.

Monday, November 21, 2016

The Return of Mapbox Streets

A few weeks ago we withdrew support for Mapbox GL Style Sheets.  You can read about our reasoning if you like.

Courtesy Mapbox

That's all changed!  Mapbox is opening up their mobile license for WhirlyGlobe-Maply users and offering competitive mobile pricing.  We're responding by making it easier to use their data.

License and Pricing


WhirlyGlobe-Maply developers will be treated just like Mapbox GL devs for tracking and billing purposes.  You should email enterprise@mapbox.com to get an amended license that will look a bit like this.


If you want to use Mapbox vector tiles on more than 50,000 devices or you're doing device tracking, talk to them.  That's all standard stuff in their agreement.  If you want the mobile pricing, talk to the sales department.

Telemetry & Offline Use


We're being treated as an equal to Mapbox GL here and that is great, but there are responsibilities. Mapbox GL sends back telemetry to improve OpenStreetMap and do traffic stuff.  We'll have to do the same.

The standalone telemetry library isn't ready and we're proceeding without it.  When it's ready, we'll integrate it with WhirlyGlobe-Maply.  It'll be on only for Mapbox data sources.

As for offline Mapbox Streets use, you're subject to the same rules as Mapbox GL.  If you ask how to work around that, I'll be happy to refer you to Mapbox's terms of service.

Who's This For?


WhirlyGlobe-Maply occupies a niche in real time data display.  We're big in weather and aviation apps, with a smattering of other specialized users.  And developers who just want a globe, obviously.

I see the biggest potential in two kinds of base maps.  First up, Mapbox Satellite Streets.  This fills in a nice hole in apps that want an optional satellite mode with a sprinkling of transportation.

Also Mapbox

Next up, a stripped down variant of Mapbox Streets suitable for data overlay.  They have a few starting points here and we can tweak a bit.

Schedule & Shout Out


WhirlyGlobe-Maply 2.5 is getting close to release so we're not going to hold it up for this.  We'll put the Mapbox GL Style Sheet support back in 2.5.1 and do a bit of testing.

Lastly, a shout out to the folks at Mapbox.  We thought you'd gone all Mapquest on us, but you haven't!  Cool.

Wednesday, September 14, 2016

MapKit Compatibility Roadmap

We get asked this one a lot:  "Why can't you be more like MapKit?"  It's a good question.

MapKit, obviously.

Internally the toolkit won't ever be more like MapKit.  But we can pretend in a couple of ways:  Overlays and Interfaces.

MapKit Overlay


MapKit provides overlay options for everything from markers to tiled image sources.  Annotations are super flexible, but very slow beyond a handful.  And don't even think about animated tile sources.  Ouch.

For some data sources it's going to be easier to render in WhirlyGlobe-Maply and slap the results on top of MapKit's UIView.

It's not topical, I just like MapKit's stations.

That's the solution.  We'll track what MapKit is up to, at least in flat map mode, and overlay our own rendering to match.  Think weather apps.

MapKit Interfaces


MapKit has a nice collection of interfaces for adding annotations, great circles, and all sorts of other good stuff.  We'll try to be more compatible with those.

Portland in MapKit.  Why not?

This means methods that take MKMapPoint or CLLocationCoordinate2D objects.  It means init calls that are similar to the MapKit equivalents.  And yes, it means working in (shudder) degrees.

The goal here is a simpler conversion from a MapKit app to a WhirlyGlobe-Maply app.

UIView vs UIViewController


This one really bugs a handful of developers.  Our main interfaces are derived from UIViewController rather than UIView.

View Controllers are nice because they have life cycle events.  You have to wire all that up yourself in a UIView.  But it's possible and we'll do it because we know you want it.

Roadmap Not Actual Size


That's the plan and this all goes in the base toolkit so it'll be free.  But we need money to do it.  Always with the money.

As with all our plans, it'll get done eventually.  Pieces will go into proposals, clients will step forward, and some of it we'll just do ourselves.

Got feedback?  Let us know.

Friday, May 13, 2016

Integration with Micello Indoor Maps

A few months ago we were approached by Micello about displaying their indoor maps in WhirlyGlobe-Maply.  They provide indoor maps to a ton of interesting companies.

Taste the Capitalism!

Seemed like an excellent idea so we went ahead and whipped up a tutorial and demo.

Micello Tutorial


Micello was kind enough to provide a few examples.  We chose the Westfield Valley Fair mall near Cupertino.  I used to live there and have a certain fondness for it.  There was also a recent story about the minimum wage change that cut right through the mall which we incorporated into the display.


If you've got a Micello account feel free to work through the tutorial and let us know if you have nay questions.

On To the Future!


Ranen put together a rather nice example app, which is what you build in the tutorial.  It shows off some fairly clever display with styles, selection and a few other things.  But we could do more for optimization, label layout, and general display flexibility.

Our example was built on the globe, but you could as easily put it on a regular map.  Doing something special for pure indoor map display is also an interesting idea, though this seems to work well enough.

WhirlyGlobe-Maply is an open source toolkit, so you can take the code and run with it.  Feel free!  But we do consulting if you've got a budget and some requirements.

Thursday, April 28, 2016

Integration with AerisWeather

We're delighted to announce integration with AerisWeather and the WhirlyGlobe-Maply mobile toolkit.

Florida: A reliable source of interesting weather


AerisWeather makes a variety of weather related products, like radar and satellite overlays.  We've done some simple integration to make those easier to use.

A Little Background


If you're coming from the AerisWeather site, you probably don't know who we (mousebird consulting inc) are.  We do high performance mobile data display.
Globe & Map

We make the WhirlyGlobe-Maply open source geospatial toolkit for iOS and Android.  It's a mobile first SDK used in a variety of weather, aerospace, map, and education apps.  It's easy to integrate, free to use, and imposes no extra costs on your app.

What We Did with AerisWeather


Our toolkit already supported a wide variety of weather and aviation apps so there was nothing difficult to add.  We just made it easier to fetch AerisWeather data layers.

There are a few new MaplyAeris objects in the toolkit.  These take your AerisWeather key, interrogate the available layers and set up the necessary WG-Maply objects.


There's a nice tutorial for iOS, so go check that out.  Ideally, use your own AerisWeather key.  Ours is just the boring demo account.

What's Next?


Our technology is used in some really ambitious weather apps.  We'd love to move a few of those techniques over to a broader base.

AerisWeater Weather Satellite Layer

AerisWeather layers are nice, but they're pure visual, like you'd use in a web browser.  Mobile devices are smarter and we know how to feed them better data.

So here's the deal.  If you're an AerisWeather user on mobile we've made it easier to use those layers in our toolkit.  That's great, but if you'd like to make it faster, smaller, and prettier, let's see what we can do together.

Wednesday, April 20, 2016

International Space Apps Challenge

This weekend I'm participating in the International Space Apps Challenge.  I'm going to build an app I've been thinking about for years, but has no commercial viability whatsoever.


That's right, it's a NASA earth data set browser.  Obviously, just a subset of earth data.  Like, the stuff that's easy to access.

Global Imagery Browser Service


NASA provides a really nice back end for accessing some of their (near) real-time data sets for the earth.  You can get a fair bit of historical data too.  And they provide a really nice web interface.  Check out NASA WorldView.


There are only two problems with this otherwise awesome web app.  First, it's a web app so mediocre on mobile devices.  Second, it's not a globe.  Because globe.

Worldview for Mobile


And that's the goal for this weekend's hackathon:  A Worldview clone for iOS devices on a globe.  We won't call it that, obviously, but I do plan to borrow its configuration files.  Because open source.  And lazy.


Now you might say "The globe and the images and... that looks hard!"  Actually, no.  I make a toolkit that does all of that.  This is going to be an exercise in user interface and add ons.  I'll deal with the user interface and...

Other People


If anyone wants to join my team, you are welcome.  It's going to be an exercise in software engineering, I'm afraid.  I can't think of much that isn't software development here, but I'm open to ideas.

I'm going to concentrate on the main user interface for iPad and iPhone.  I can think of a few other features that might be very cool and (best of all) largely separate.

  • Star field:  The toolkit has one, but I've never verified that it makes any sense.  You could make it look better, update it based on the time and verify that it's correct.
  • Planets: We're using the AA+ toolkit for sun and moon positions.  You could add the planets.
  • Sun & Moon: The existing sun and moon are there, but they could look better.  Phase of the moon would be cool.
  • Satellites: All of the satellites that contribute data have predictable positions.  It'd be cool to see their locations at any given time and perhaps their tracks.
  • Other data sets: Got other earth data sets you'd like to see?  Might be easy enough to add.
Anything you can think of is fair game too, of course.

The app itself will be released open source and, if we get something good, published to the app store after a little testing.

Tuesday, March 29, 2016

Map Features in WhirlyGlobe-Maply

I'm going to discuss map related features of the WhirlyGlobe-Maply toolkit. The SDK is an open source, mobile centric geospatial display toolkit. It’s used in a variety of weather, aviation, geography and map apps.
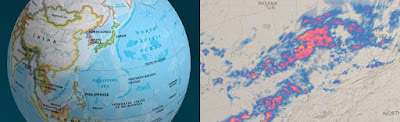
Two of the more prominent examples are Dark Sky, a weather app and National Geographic World Atlas, which is exactly what it sounds like.

NatGeo World Atlas & Dark Sky

The globe apps are best known, but WhirlyGlobe-Maply has huge support for traditional 2D map apps too.  We're going to talk about some of those features, but let's start with map apps in general and one in particular.

Map Apps


Mapping is one of the more popular categories in the app stores. Both Apple and Google have their own map offerings and toolkits, but they're poor if you have your own data? That’s where toolkits like WhirlyGlobe-Maply come in and we’ve built a number of features specifically for those sorts of apps.

One of the more capable map apps that uses the toolkit is Gaia GPS.
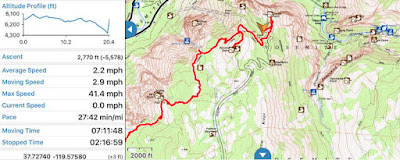
Fact: 30% of hiking app screenshots are Yosemite.

Gaia GPS displays a variety of image and vector based data sources. It’s popular among the backpacking and off roading communities.  It can work without a network and is very careful with battery.

Let’s move on to one of the key features for nearly every map app: Image Tiles.

Image Tiles


A basic feature required for map display is loading and rendering of image tiles. We’ve moved well beyond Web Map Service on mobile devices and we now expect tiles. This might be a Web Map Tile Service (WMTS), but is more likely to be a fixed quad tree of tiles like that coming from Google Maps or OpenStreetMap.


Efficient image tile loading is a tricky problem. Mobile devices have network constraints and we want to make careful use of data caching. WG-Maply can handle this for both globe and map, but there’s an interesting variant for the map case.


In the example we’re loading three levels of tiles based on the current window. We start with an extremely low resolution, then overlay that with slightly higher resolution and finally toss in the proper resolution. It gives the user something to look at while the system loads the good stuff.

Tricks like these are important to efficient map display on mobile, but let’s take a quick detour through some really basic functionality.

Vectors, Labels and Markers


Any credible map toolkit should be able to display some basic features and WhirlyGlobe-Maply is no exception. These include vectors for areal and linear features, labels for points and of course markers.


All very simple to us.  Vectors, for example can be consumed from a variety of data sources, like GeoJSON or (ESRI Shapefile). Labels and markers are 2D features and can interact through an adaptive layout engine.  All of them provide selection feedback too.

It’s what the developers do with these features that gets interesting. That leads us to a complex modern feature: vector tiles.

Vector Tiles


Mapbox has popularized vector tiles with their OpenStreetMap data set. Theirs is a Google Protobuf based format, which is as complex as it sounds. The fundamental ideas are simpler.

Vector tiles are to image tiles as vectors are to images. They are just chopped up geometry representing what’s in each map tile. You can use them much more flexibly than images.
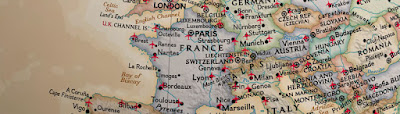
A very custom example of vector tiles.
Believe it or not, National Geographic World Atlas uses vector tiles hosted by Mapbox.  The rest of it is completely custom.  And, okay, it's technically a globe.  But if National Geographic doesn’t have some cartographic street cred, nothing does.
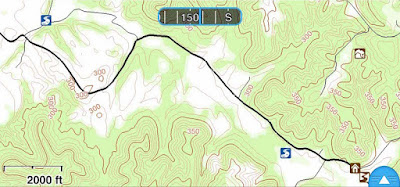
A more normal use of vector tiles.

The Gaia GPS developers use vector tiles they generate themselves to draw contour lines. The data is styled using Mapnik XML which is associated with the Mapnik map renderer.  Gaia GPS also has a street layer based on the same approach.

WhirlyGlobe-Maply has vector tile support down solid, but style support is still in flux and likely to be for a while. We can support older style formats like Mapnik XML and developers can always go off on their own. Newer formats like Mapbox GL Style Sheets are not fully supported yet. We also hope to add in Styled Layer Descriptor since it's an actual standard.

Vector Tiles are a bit trippy so let’s go back to some more basic map features.

Wide Vectors


Widened vectors are one of those obvious things that require some work to implement.  OpenGL ES has a basic line implementation, but it looks kind of... meh.  If you want lines that have smooth edges and neat little joins, you need something more.


WhirlyGlobe-Maply's implementation involves a custom OpenGL ES shader and a bit of math.  Line intersections are calculated on the fly (sort of) and width can be varied as needed.  Typically this just looks like constant width lines as the user moves in and out.

Look deep into my shader
Oh, and you can do dashed lines and other effects.  Wide vectors work both on the flat map and the globe, but they're primarily a map feature, just like the next one: clustering.

Marker Clustering


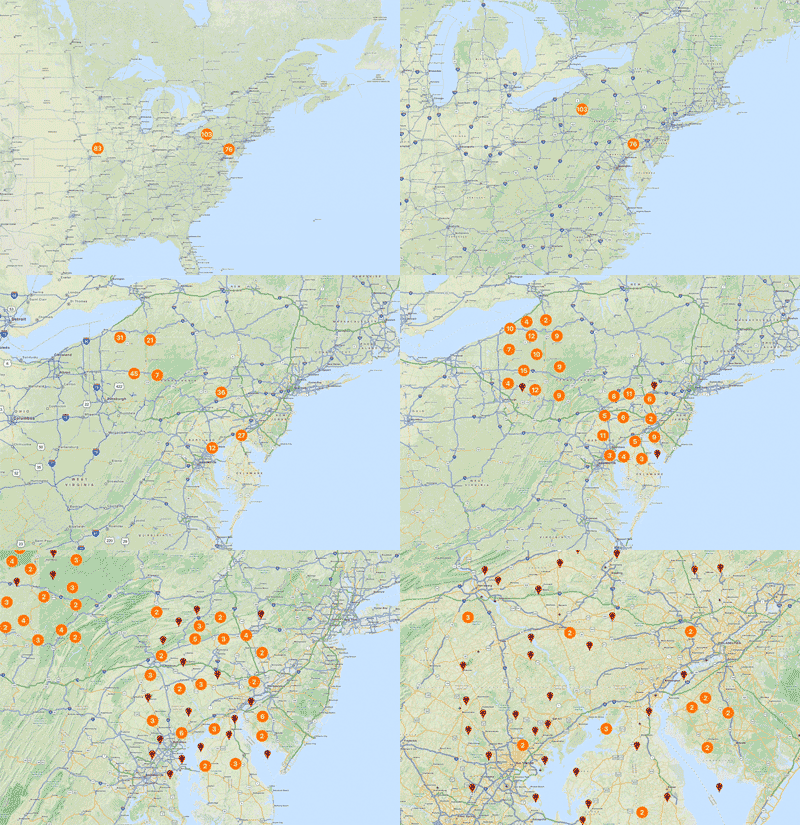
Clustering markers is a pretty simple idea. When you have a lot of markers on your map, it can look bad. Best to gather them up into groups and display the groups.


Simple enough, but our maps move so we have to do something more. As the user zooms in, the groups come apart and as zoom move out, the groups form. It’s tricky to implement, but looks quite nice.


In truth, clustering can be used on both the globe and the map even it’s nominally a map feature. Let’s look at something purely from the 2D map.

Infinite Scrolling


For certain types of map projections, the extreme west and east extents represent the same point (really, line). This means the user expects to move the map and have it wrap around.
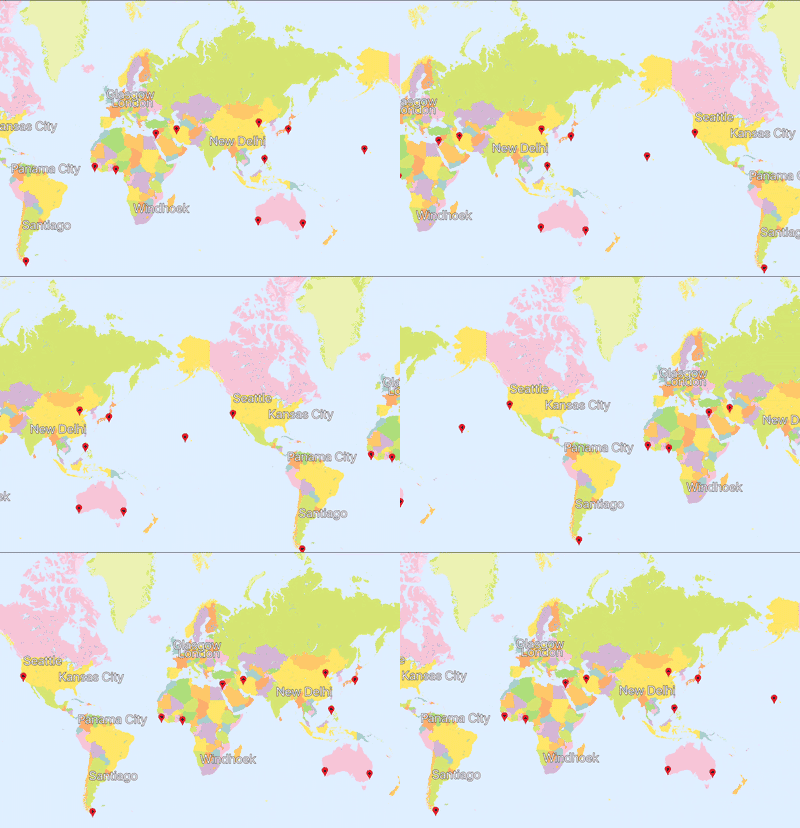
Bonus question: What about wrapping top to bottom?

Infinite scrolling is simple in concept, but tricky to implement. The rendering isn’t bad, but when you add in feature selection and overlaid data it gets interesting. You know what else is interesting? Map projections.

Map Projections


The real test of a map toolkit is whether it handles explicit map projections. Actually, that’s not true. Plenty of map toolkits only work in a simple map projection, known as web mercator. But if you want to hold your head high in a room full of cartographers, you should have map projection support.
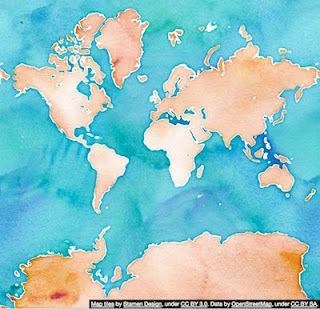
Does this projection make my poles look big?

Web mercator, shown here, is the most common projection in use on mobile. It has its problems, particularly near the poles. We can thank Google Maps’ dominance for this affront to cartography.  There's data in plenty of other projections and good reason to use them.


From left to right we’ve got:
  • A data source in British National Grid overlaid on a web mercator map.
  • The same data source overlaid on a British National Grid map. The web mercator data source is being reprojected.
  • The same thing on a globe. Because it looks cool.
Though the vast majority of our users will always use web mercator, WhirlyGlobe-Maply can do more. It uses the Proj.4 coordinate system package internally and can handle a variety of useful map projections.

Conclusion


Map toolkits for mobile devices are hot right now. There are a number of excellent ones, though most are tied to specific data services like Apple or Google or are proprietary or both.  A few are open source, like WhirlyGlobe-Maply.

We’ve discussed some basic features and a few advanced ones we consider essential for map display on mobile. If you’re looking to build an app, we hope you’ll look beyond the proprietary services to something like WhirlyGlobe-Maply.

Special thanks to Stamen for the Stamen Watercolor map tiles, derived from OpenStreetMap data, used in many of these examples.

Monday, March 14, 2016

Map Projections

Let's talk map features.  How about custom projections?

Does this projection make my poles look big?

Spherical Mercator (web mercator) is the most common map projection you'll see.  It's a fairly simple unraveling of the earth, but its main purpose is to annoy cartographers.  Did you know the EPSG code for Web Mercator stands for "DIAF".  True fact.  Look it up.

Our users mostly stick with web mercator, but we now let you specify your own custom projection.

Proj.4 CoordinateSystem


Like all the cool kids we use Proj.4 to represent coordinate systems.  In theory this allowed us to use a wide variety of systems.  In practice, we just used Spherical Mercator, Plate Carree and a very weak geocentric.

Recently we exposed Proj.4 directly with a MaplyProj4CoordSystem.  It's simple enough, if you're familiar with Proj.4.  Here's an example for British National Grid.

Full disclosure, there's actually a datum grid shift that goes with that for proper BNG.  We've shortened it for the example.

You can get these Proj.4 strings from spatialreference.org, among other places.  But odds are if you have the need, you already have the string.

British National Grid


The folks at Ordnance Survey were kind enough to help us sort this out.  Let's look specifically at the British National Grid, starting with a data source in BNG.

BNG tile source on spherical mercator


That's a 2D map with a base layer in web mercator (Stamen Watercolor) overlaid with a dummy tile source in BNG.  As far as these things go, that's the easy case.  Let's look at a more difficult one where the map itself in BNG.

BNG tile source on BNG map


In this one the map is in BNG with a base layer in web mercator and an overlaid dummy tile source in BNG.

That's pretty cool!  Web mercator stretches far outside the boundaries of the BNG system, so we convert the tiles to BNG and toss out any that don't overlap.  And it works!  But there's more.

BNG tile source on globe

Okay, not all that difficult as these things go but it looks cool.  We're just overlaying a dummy BNG source on the globe.

You can find all of these examples in the AutoTester app for iOS.  And there's more...

Android


This is something I hope to say a lot more in the future:  Custom map projections are also available on Android in the develop_3_0 branch!

A triptych of British National Grid

You can find these examples in the AutoTester app for Android.  I'll explain AutoTester in more detail soon, but it's already been a great help in development.

Next Up


The hard part here was tracking down the weird corner cases and systems which just don't play well with each other.  There are likely to be a few more like that, so let me know what you find.

We've got more map features in the queue, including some vector data display.  Stay tuned!

Friday, March 4, 2016

CartoType GL

In cooperation with CartoType Ltd, I am proud to announce CartoType GL for iOS and Android.

Parks are green!

CartoType GL is the next generation of the CartoType map toolkit.  It's got all the flexibility of the existing library for map representation, routing and address searching, but we've add a zippy OpenGL ES renderer.

What is CartoType?


CartoType is an offline map library that works with limited resources.  This makes it popular on smartphones and other situations where the user is not connected to a network.  It can handle a variety of data inputs, making it easy to use your own data, but can also deal with the usual OpenStreetMap cases.

I wonder where this is?

The existing CartoType library does a really nice job representing complicated maps in a very small space.  It's primarily a static map rendering library, so when you use it on a smartphone it'll render the map when you stop moving.  What we've done is upgrade the renderer.

What is CartoType GL?


CartoType was already doing a fine job representing maps.  What it needed was to draw them faster.  CartoType GL is just what it sounds like, an OpenGL ES based version of CartoType that solves the speed problem.


CartoType GL marshals the resources of the existing library to convert data to internal vector tiles.  Those are are processed into OpenGL ES compatible data and rendered at a nice zippy, interactive speed.  Basically just what you'd expect in a modern map toolkit.

Online vs. Offline


There are some excellent cloud based map solutions out there for map representation, routing, address searching and so forth.  CartoType GL is not that; it's an offline solution.

I have no idea where this is.

Why offline?  Well, it's actually a different problem.  You can cobble together offline solutions from the online technology, but they're not great.  They're too big, they don't do routing well and they're focused on display.  If you want to do a good offline map toolkit it's a different beast.  That's what CartoType is.

Cost & Availability


CartoType GL is, logically enough, being sold through the CartoType company.  They are the ultimate source of details on this effort.  Contact them for a license.

We hope to get the iOS version out in April.  Android should follow shortly after that.

Boring Technical Details


WhirlyGlobe-Maply is the open source toolkit we (mousebird consulting inc) make and it has two levels.  The core is a C++ rendering and object management engine.  Above that is an Objective-C interface on iOS and a Java interface on Android.

CartoType GL uses the core C++ renderer directly.  Rather than expose high level WG-Maply functionality, we interface with the GL renderer.  This makes CartoType GL a much simpler map centered toolkit.

WhirlyGlobe-Maply is and will continue to be open source.  This arrangement is just like one of the commercial apps that we work on.  It's even contributing functionality back, making the toolkit better for everyone.