Friday, March 21, 2014

WhirlyViz 1.2 - Update

The latest WhirlyViz is on the app store.  It's a bit faster, more reliable and has better navigation, particularly for the phone.  But most importantly, there's new functionality.

San Francisco is very brown today
If you're just tuning in, WhirlyViz is a geospatial display app for iOS which I've discussed before.  It's based on client projects and a few of my own.  One of those was.....

TransitVis


The TransitVis app was an experiment and an entry for a hackathon.  It was a great way to work through some data viz issues without a client breathing down my neck.  We can now duplicate the TransitVis app with a configuration file.

Like many of the other examples, I'm using CartoDB on the back end.  When the user changes parameters or taps on a data value it's sending off a SQL query.

The 14 isn't transit, it's dinner and a show.

Election Map


Everyone needs an election map!  With the 2014 midterms coming up, I'd love to see some WhirlyViz based election maps in prominent apps.  And if not, there's always 2016...

The only time Ross Perot is described as "pretty".

I put this one together from county census voting data from 1980 to 2008 and used the Purple America algorithm to get some nice blended colors.  The 1992 election is interesting since there was a third party candidate and you get some green.

Next for WhirlyViz


Demos, demos, demos.  More demos is the main thing.  I'm lining up a few with collaborators rather than writing any more of my own.

I've also been experimenting with Javascript in the configuration files.  I like it!  There will be more of that.

Tuesday, March 18, 2014

Vector Maps - Introduction

Here's the short version:  Vector Maps!  Yes we can!

Edit: Go check out Mapbox vector tiles and Thunderforest Lighting vector tiles too.

Somewhere in Brazil

WhirlyGlobe-Maply has had vector support for years.  As the versions went by that got much better, but vector maps were still a leap.  There were three missing pieces:
  • Paging: Efficient loading of individual tiles.
  • Styling: Specifying how a map looks.
  • Workflow: Getting from raw data to pretty map (open source, 'natch)

I'd done a few experiments and I was pretty clear on how to solve this.  All I needed was clients with the money to get it done.  I found them, we did it, and it works!

There's a lot to cover, so let's look at the big picture.

TileMill


It all starts with TileMill, MapBox's excellent free map making tool.  With TileMill you set up your data and then style your map with CartoCSS.  It's fairly intuitive and, best of all, well documented.

Braaaaaziiiiiil!

Under the hood Mapnik is the open source workhorse for TileMill.  Mapnik takes the data for the map, the styling information and makes pretty map tiles.

Mapnik is tres cool, but we're not actually using it to do the work.

Mapnik XML


Okay, so we're not using Mapnik, but we are using its configuration file.  See, Mapnik has this great file format that specifies absolutely everything you could want in one place.


Yup it's XML.  XML is like reading a headache, but it's fantastic for data processing.  It's got references to data sources, like Shapefiles or PostGIS queries.  It's got styles laid out in glorious detail.  It's got everything we need.  And did you know you could get Mapnik XML out of TileMill? 

Bet you always pick MBTiles.

We style the pretty map in TileMill, we export the Mapnik XML and that goes directly into the next stage.

Carto Vector Dice


Here's where we go off the rails.  I've got a new command line program that does the rest of the work.

The vectors going into TileMill are bad for rendering.  We need things diced, sorted, and organized.  That's what this program does.  It sifts, chops, and organizes the data by style and level.

That's where it gets tricky.  CartoCSS and TileMill aren't really designed for vector maps and they cheat really well with image tiles.  Rather than carefully select the right data to go in, you can throw it all in and let priority sort it out.  Now, that's not entirely fair, it does slow down your tile construction, but it's a much bigger problem with vectors.

Well.... how about just the one 40MB tile?

carto_vector_dice can sort out much of that.  Referencing the same data multiple times is really common in CartoCSS.  We can catch this and use multiple styles for the same data.  Even so, picking the right detail for the right level is something of an art.

Once all the dicing, sorting, and grouping is done, carto_vector_dice writes all this glorious data out to a database.

Maply Vector Tiles


The vector tiles are stored in a sqlite database.  There's one tile per (x,y,level) and a table of style information.  The data for each tile is compressed and stored in a blob, encoding all the traditional vector types and attribution.

Water Table.  I'm hilarious.
Putting everything into one database makes it easy to move around, but we've also planned for the future.  The style table uses UUIDs so we can reference styles globally.  The tiles are self contained so fetching over the network will be a cinch.

Vector Map Rendering


All of this work has one goal:  Get the vectors to the renderer.  Maply can now render a vector map with the following code.

Seriously, that's it.  There's a lot going on under the hood, but it's all surprisingly rational.  And it works great.

Insira espirituoso legenda aqui

One thing I gotta point out here.  We're not rendering map tiles and drawing the images.  We're Drawing.  The Actual.  Vectors.

Look, smartphones can handle this.  They've been able to for years now.  There's no reason not to render the vectors in a lot of cases.

I Want It!


So can you use it?  Well, in theory you can.  If you're a developer and you're familiar with GIS and a bunch of other stuff, probably.  If you're not, I would wait a bit.

I use this stuff with clients and I'm very happy with it, but it's got some rough edges.  Every new CartoCSS style is an adventure.  If you try it yourself, be patient and maybe drop me an email.

Future Stuff


The big, risky part is done and works.  There's plenty more to do, though.  I've got a long, long list of things clients may want.  If you want one of them, you could be a client too!

So that's it.  Vector maps work in Maply.  The workflow is in place and it's open source.  Look for improvements in the future and, of course, I'll have more to say on the blog.

Tuesday, March 4, 2014

Maply Android Update

I've been hard at work on an Android version of WhirlyGlobe-Maply.  Here it is.  Or a screenshot anyway.

Little Android thing up there on the left.  Totally authentic.
Actually I implemented OpenStreetMap vectors first, but everybody loves the satellite imagery.

The toolkit is pretty big these days, so how much of it is done?

Basic Functionality


The biggest chunk is the core, as you might imagine.  Just getting the rendering up and going took a while.  At the user level, there are three big pieces done:

  1. Quad-tree Image Tile Layer.  This is what everyone thinks of as a remotely paged basemap.  You know, the things you get from Bing or MapBox.  Not Google, you don't get to play with those yourself.
  2. Vectors, Markers, Labels.  These are the basic objects we use to represent things, particularly maps.
  3. Quad-tree Paging Layer.  This is how you implement a tiled vector map.  As a test case, I've hooked it up to the vector tiles on the US OpenStreetMap server.

Vector Maps!
There's plenty yet to do.  Tiled basemap animation, full vector maps, the globe, efficient labels, feature animation, the list goes on.  It'll be a while before the port is complete.

A Few Details


A full writeup of how WhirlyGlobe-Maply 3.0 is working and will work would take a while.  So let's just hit the major points of the Maply Android port.  First, the roadmap.

  • WhirlyGlobe-Maply 2.2 is out now for iOS.  
  • WG-Maply 2.3 will come out in the next couple of months
  • That's probably the last 2.x version.  
  • WG-Maply 3.0 is cross platform and already under development for both Android and iOS.


The rendering engine is C++.   In 2.2 it was Objective-C++ (yes, that's a thing), but now it's just C++.  On iOS very little is changing at the user level.  On Android there's an entirely new Java interface corresponding to the "Component".

To interface the Java and C++ I'm using the Java Native Interface.  It's painful, but you won't ever have to see it.

One consequence of the design is that I'm using each platform's threading model.  On Android, it's all Java threads and queues.  On iOS it's Grand Central Dispatch.  This means more code, but it fits very well into each platform's world view and will be more friendly to each tribe of developers.

General Release


I've got one more big delivery on this version of the Android port.  At that point I'll put the toolkit into a closed beta.  If you want access to it, you need to pay for some functionality.  Don't worry, there's plenty left to pay for.

When I'm happy with the Android port I'll release it generally.  That's where this is heading, of course, a cross platform open source geospatial display toolkit.  It's starting to look pretty good.  If you need it for a project, drop me a line, preferably with some money attached.

Monday, March 3, 2014

Teaming up with Gaia GPS

Here's the short version.  I'm taking on bigger contracting projects with these guys.  Read on for the details.


The Background


I'm a consultant.  That's like a contractor, only more expensive.  I make a living on WhirlyGlobe-Maply projects.

Used to be I'd write the whole app.  That got unwieldy, so then I just wrote the map or globe part.  Now I usually just add features to the toolkit and show people how to use them.

That's working great, but I miss seeing the whole app, developing something from start to finish.  There's no practical way I can ever do that again, especially with Android support coming up, but I'd like to get my hand back in.

And on a purely practical level, I pass up a lot of business.  Clients approach me about doing whole apps, but I don't have the time to do a proper bid or the people to call on for the rest of it.

So I'm teaming up with someone who does.  But first, why do I really care?

The Motivation: Aviation & Vector Maps


Aviation companies are pretty big users of WhirlyGlobe-Maply.  It's not hard to see why.  Pilots like their iDevices and they have money.  And boy do they need to display maps.

A few years ago I made a deal in aviation that locked me out of the market.  I have no regrets, it worked out great.  Now the exclusion is expiring and I'm free to do aviation work.

The globe thing has been nice, but I've been pushing the 2D version, Maply, more lately.  That's borne fruit and 2D vector maps are coming on line soon.  WhirlyGlobe-Maply has always been able to do vectors, but now we can style them respectably.

There'll be more about this leading up to State Of the Map US.  We'll be showing the vector maps at a booth there under the Maply banner.  That is, myself and...

The Partner: Gaia GPS


The company I'm working with makes the hit outdoor app, Gaia GPS, and similar apps for activities like boating and 4x4 navigation. They're experienced in geospatial data display, mobile app development, and they're local, based in Berkeley.  It's a good combination.

A couple months ago, they started moving their apps to use Maply, and they quickly started to send me valuable feedback and pull requests to update the Maply core.  They very much get geospatial, from the display side as well as the sort of adhoc data processing you always find yourself doing.  Between that and the OEM work, they're a good contracting partner.  They also have more people than I do (4 full-time developers and some part-time people), which is a big plus.

The Conclusion


For the toolkit nothing is going to change.  It's still open source, still available under the Apache 2.0 license.  Same for Android when that comes out of beta.

On the business side we'll be pursuing larger deals.  WhirlyGlobe might play a part, but Maply and vector maps will be our big focus.  If you're a client, don't worry, mousebird will still be taking on smaller technology contracts like we do now.

If you've got a mapping app in the works and you need a bigger team, drop me a line.  We'd love to talk about it.

Thursday, February 27, 2014

WhirlyViz Demo

The other day I was planning to give a short talk on WhirlyViz at the San Francisco GeoMeetup.  Due to equipment problems it never happened.

Rather than let slides go to waste, here's the talk in video form.


You can get WhirlyViz on the app store.

The URLs I use as examples can be found in a previous blog post.

Tuesday, February 25, 2014

WhirlyViz - A Quick Introduction

A few weeks ago we put together an app called WhirlyViz.  And then I got busy with other things.  Android and vectors maps, if you're curious.

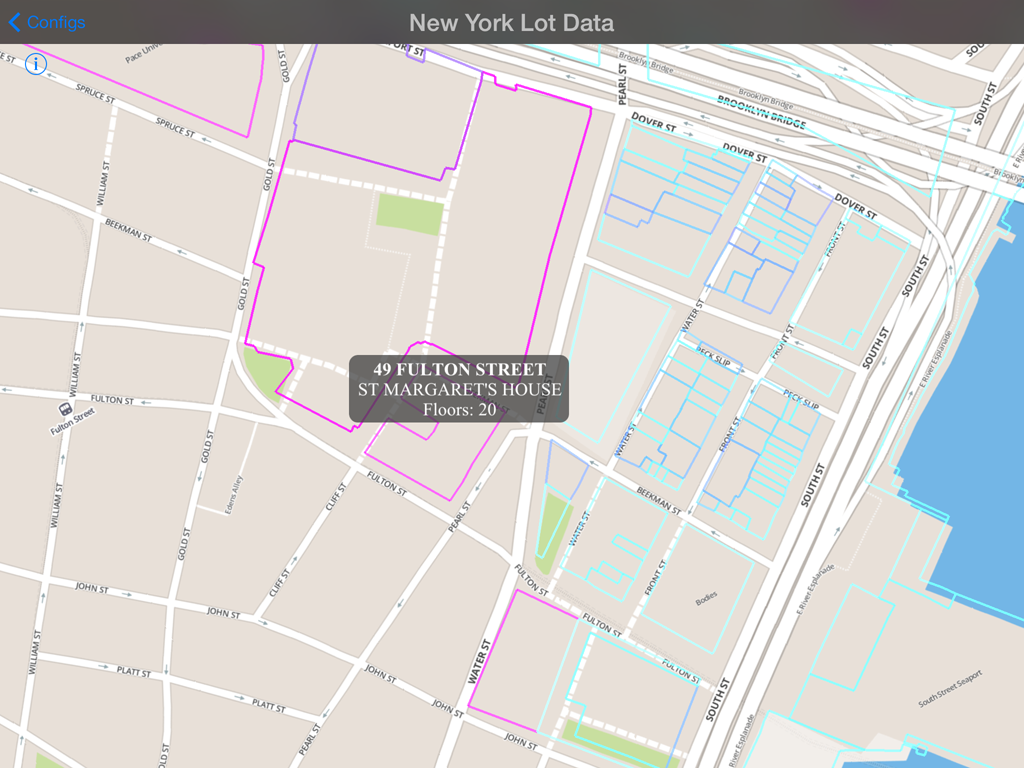
Property in New York that you do not own.  Nor I.

What is WhirlyViz?


WhirlyViz is a geospatial display app for iPhone and iPad.  It displays data, like vectors and maps, in relation to each other.  Then it lets users interact with the data.  Oh, and it's free.

It's an outgrowth of client and user projects.  A lot of my users slap a few vectors on top of a base map and then let the user tap on them.  I figured I could automate that case.... as well as some more interesting ones.

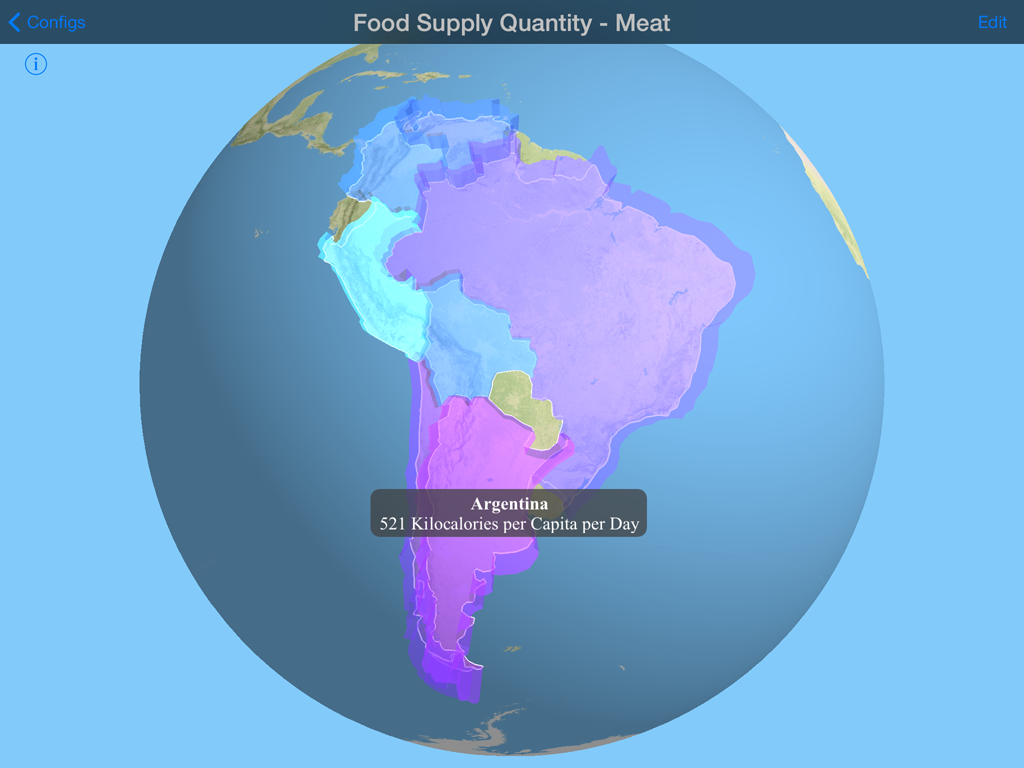
Seriously, there's a country that eats a lot of meat.

I'm not ready to roll out the complicated cases yet.  They get complicated.  But the simple cases are ready to go.

GeoJSON Overlay in WhirlyViz


Ever wanted to display a GeoJSON file on your iPad?  Yes, you could use Leaflet and Safari.  Ever wanted it to be fast and not annoying?  Well, I can hook you up.

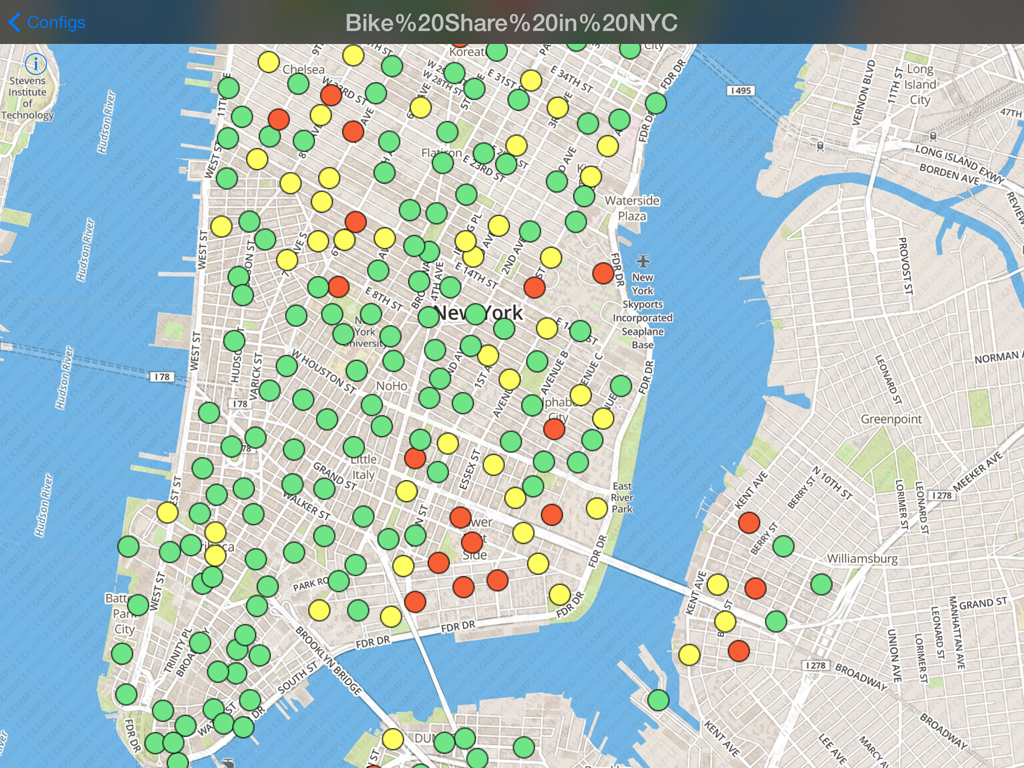
Dude, I could have totally had a bike, like, two years ago.

That's an incredibly old snapshot of New York bike share availability.  It's just a GeoJSON file slapped on top of a standard MapBox basemap.

And you can make these yourself!  It's actually quite easy.  First, some examples.

WhirlyViz URL Examples


First off, you need to install WhirlyViz on your iPad or iPhone.  Go ahead, I can wait.

Now come back to this page in Safari and click on the links below.

  Chicago zip codes displayed in red on a globe

  Chicago Zip Codes 

  Country-like regions from Natural Earth Data

  Admin 0 boundaries (sort of countries) from NaturalEarthData

  An example with a handful of bars in Washington, DC using icons

  Bars in Washington, DC

  A snapshot of city bike share stats from New York also using icons

  BikeShare in New York, NY

Load up any of these and tap on the vectors.  You'll see the attributes on the GeoJSON data.

Anatomy of a WhirlyViz URL


Did you know you could make custom URLs for iOS apps?  Well you can.  Developers do it all the time.  All WhirlyViz URLs start out like so:

That tells iOS we want to invoke WhirlyViz and it tells WhirlyViz to get ready to display something.  Then we have a bunch of arguments.
  • name=<name>   The display name the user sees up top.
  • basemap=<url>  The json file describing the basemap we'd like to see
  • geojson=<url>    A GeoJSON file to slap on top of the basemap
  • type=<globe/map2d>  Whether we want a 2D map or a 3D globe
  • vecwidth=<width>      Width of any following vectors
  • veccolor=<hex color>  Color of any following vectors
  • vecfilled=<yes/no>      Whether or not vectors are filled
  • clearcolor=<hexcolor> The background color for the globe

The Chicago zip code example is constructed like this.

And here's what it's doing:
  • Puts the name "Chicago Zip Codes" up top.
  • Tosses down an example MapBox basemap.
  • Puts up a zipcode GeoJSON file with vector outlines in red.
  • Puts up the same zipcode file with translucent red filled polygons.

You can make those yourself.  It's really not that hard.  I like to construct them in email and mail them to myself on the device.

Future of WhirlyViz


On the complicated side, there's a lot to do.  WhirlyViz has some crazy features that'll take a while to shake out.  Some actual clients using it might be nice.

On the simpler side, I'm happy to add features to the GeoJSON display.  The styles github supports would be a good start.  Just try it and let me know what you did!

Thursday, February 6, 2014

Dark Sky 4.0

It's been a while since I've posted.  For those of you keeping track (e.g. no one) that means I've been busy implementing stuff.  Here's one of those things.


Hey midwest, your suffering is particularly beautiful.

The new Dark Sky uses WhirlyGlobe.  And boy does it ever use it.  The animated weather is gorgeous and pushes the new layer animation functionality to the breaking point.

Random Update On Stuff


Yeah, there's animation support in the image layer now.  Shader support too.  I should really write that up.  In fact there's a little note on my desk which says "Write up Animation Support".  It also says "Android Update" and "Vector Maps Update" so perhaps I'll write those up as well.

For now, here's the capsule version:
  • Animated image layer support?  Yup.
  • Custom shaders?  Oh yeah.
  • How's the Android port going?  The OSM Vector example is working.
  • Vector maps?  Yup, using TileMill for styling.
  • Are they fast?  Oh yes, they are very fast.
That'll have to do for now.  If you have specific questions, feel free to hit me up.